What's the Difference: Charts vs Graphs?
Need a clear visual guide? Learn the key differences between charts and graphs, how to read them, and get practical tips to choose the right one for your needs.
You're probably here because you need a quick clarification on charts vs graphs and want to ensure you're using the right tool for the job. It's a common dilemma, and understanding the difference is key to presenting your data effectively. So, let's break it down simply.
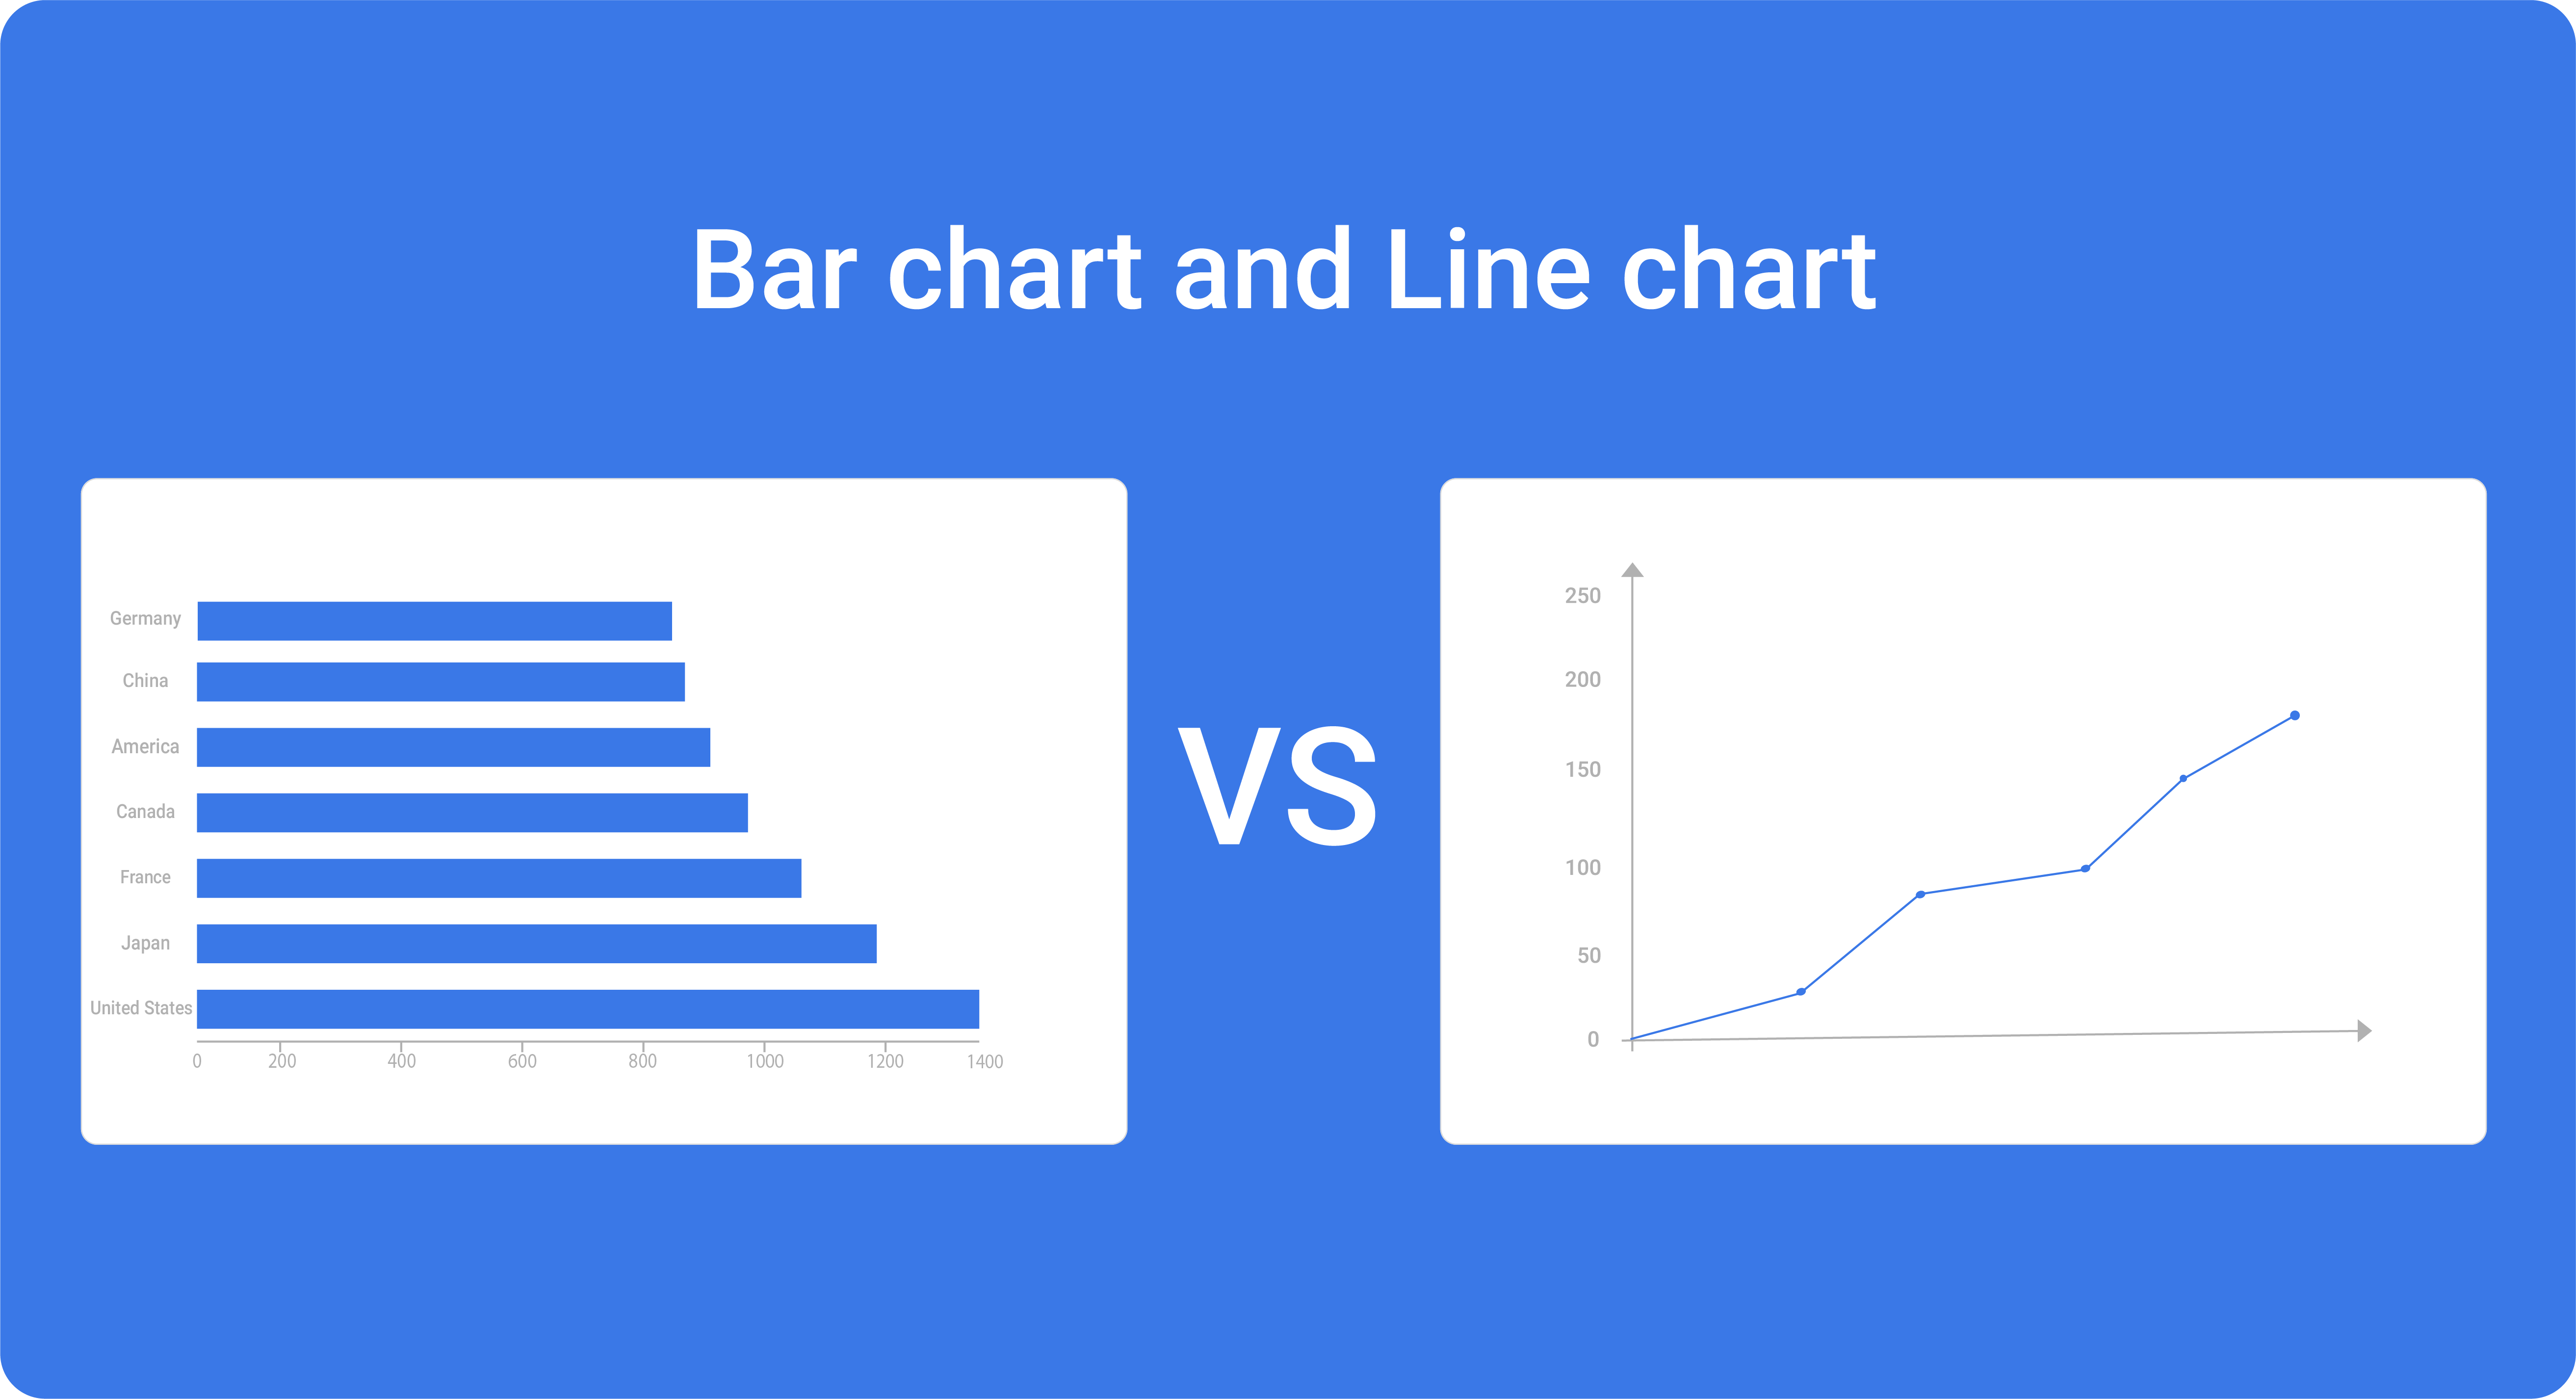
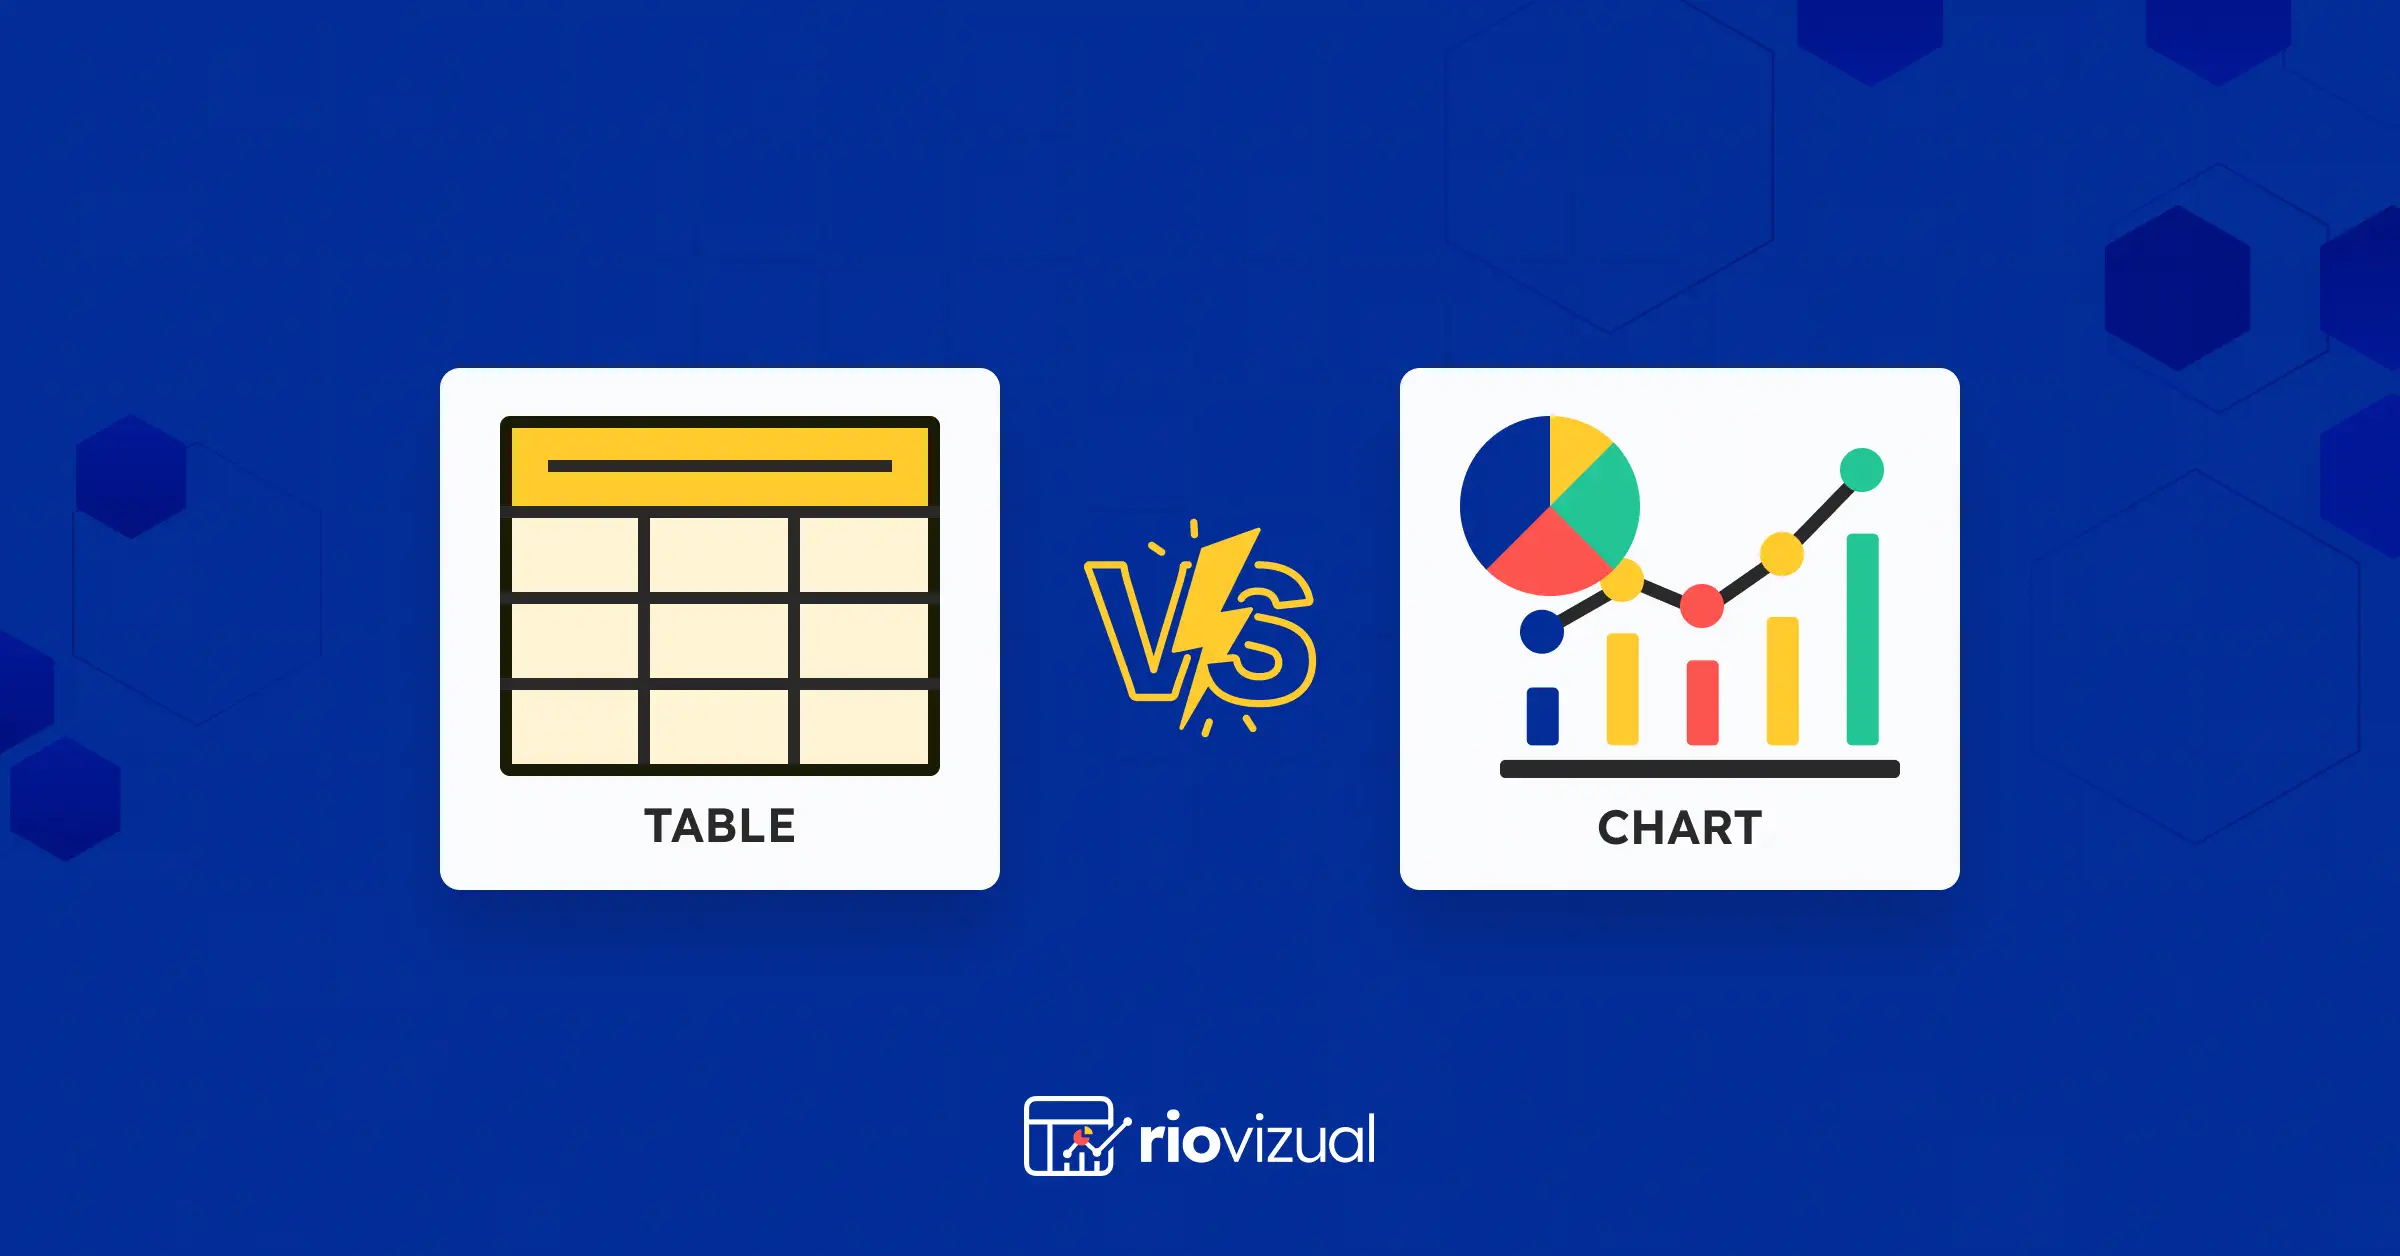
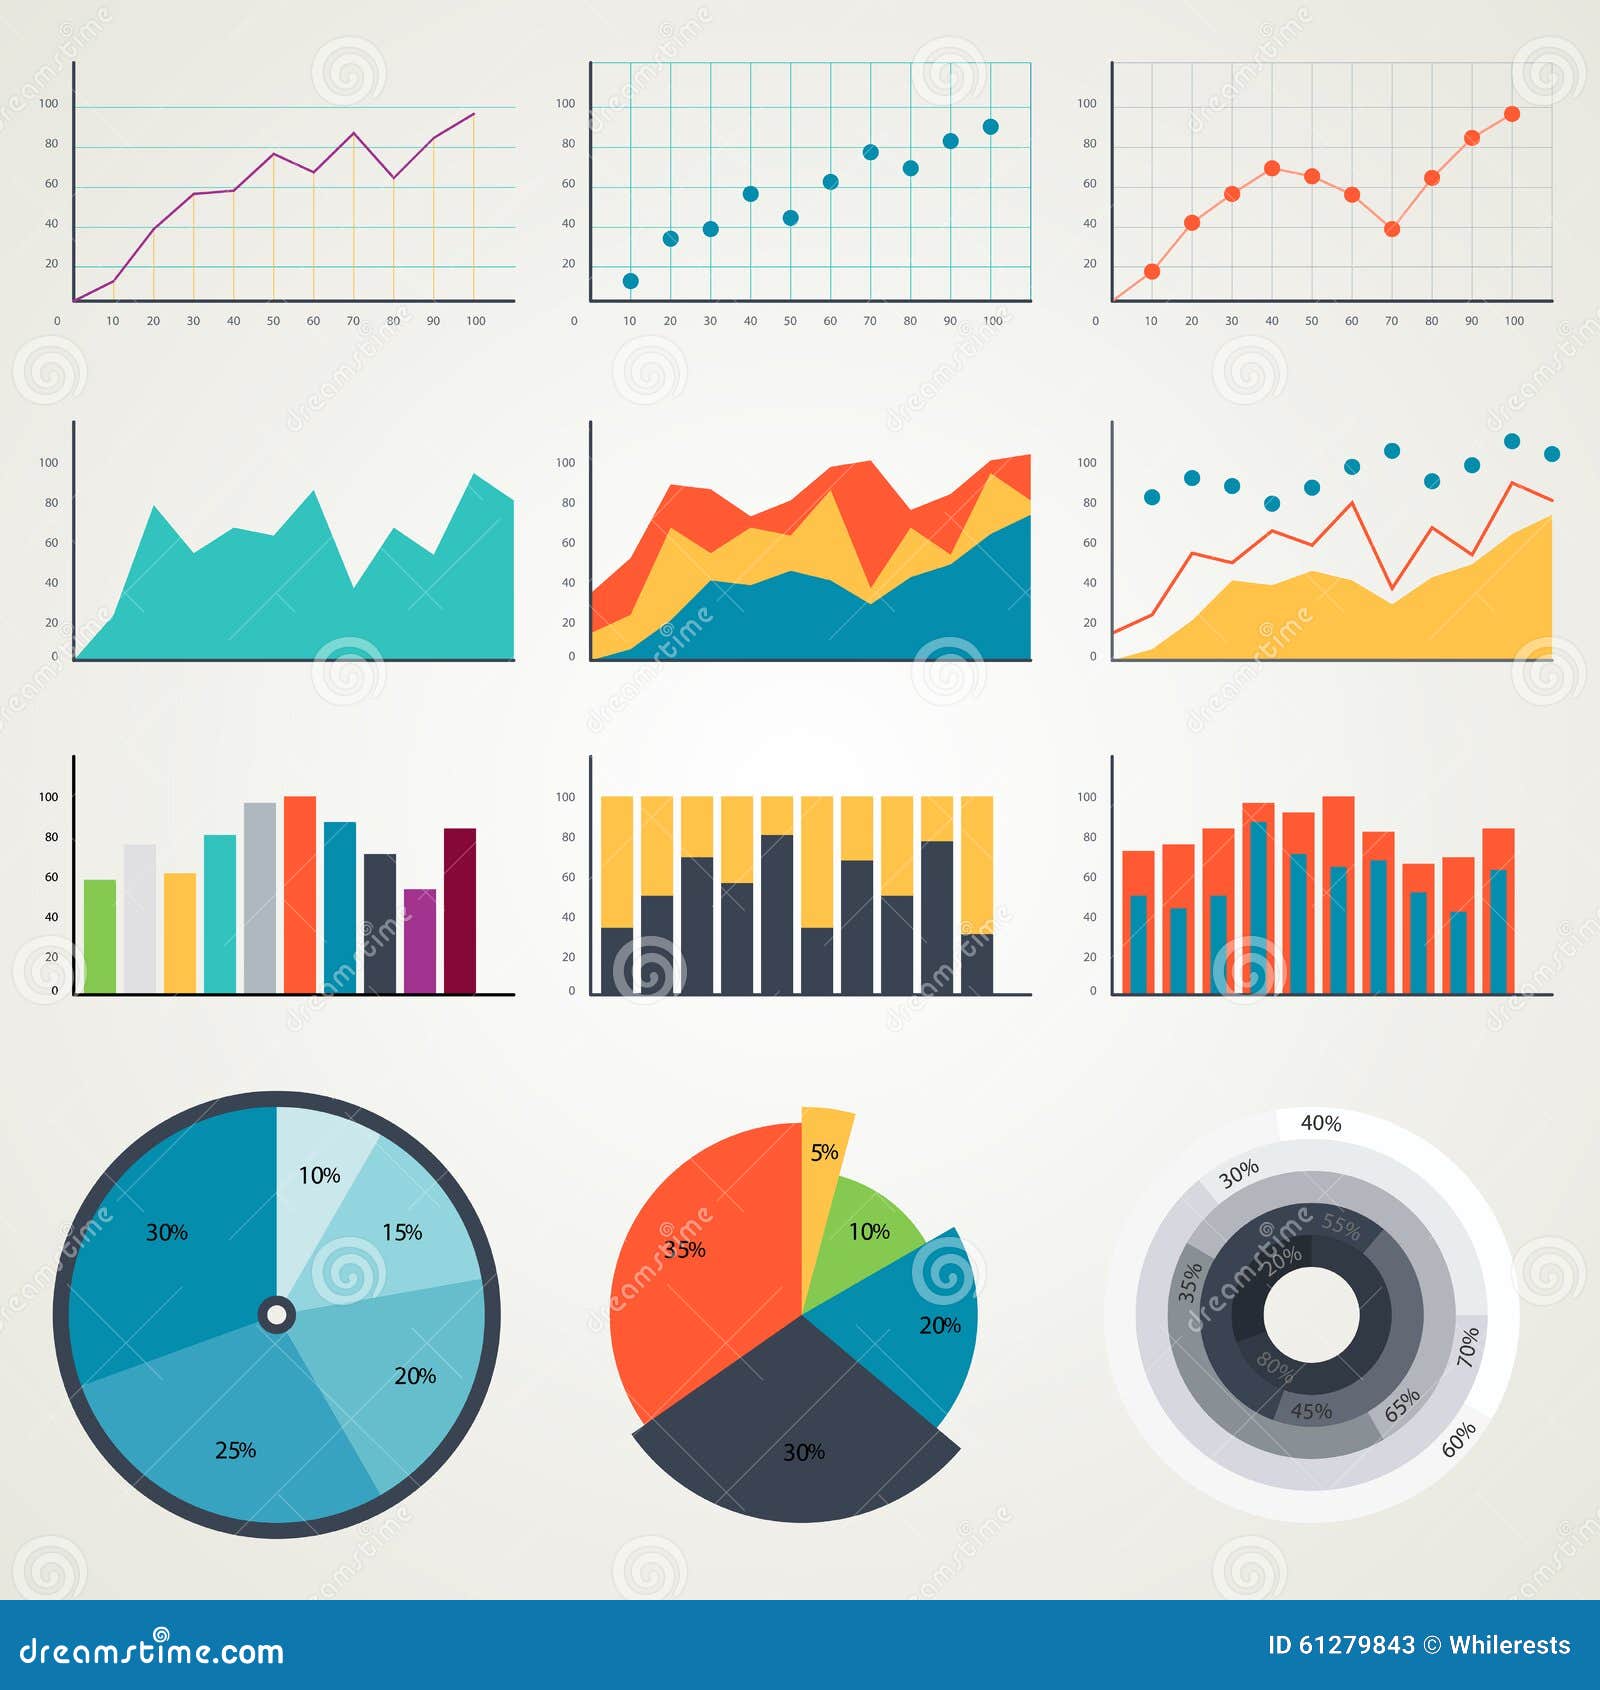
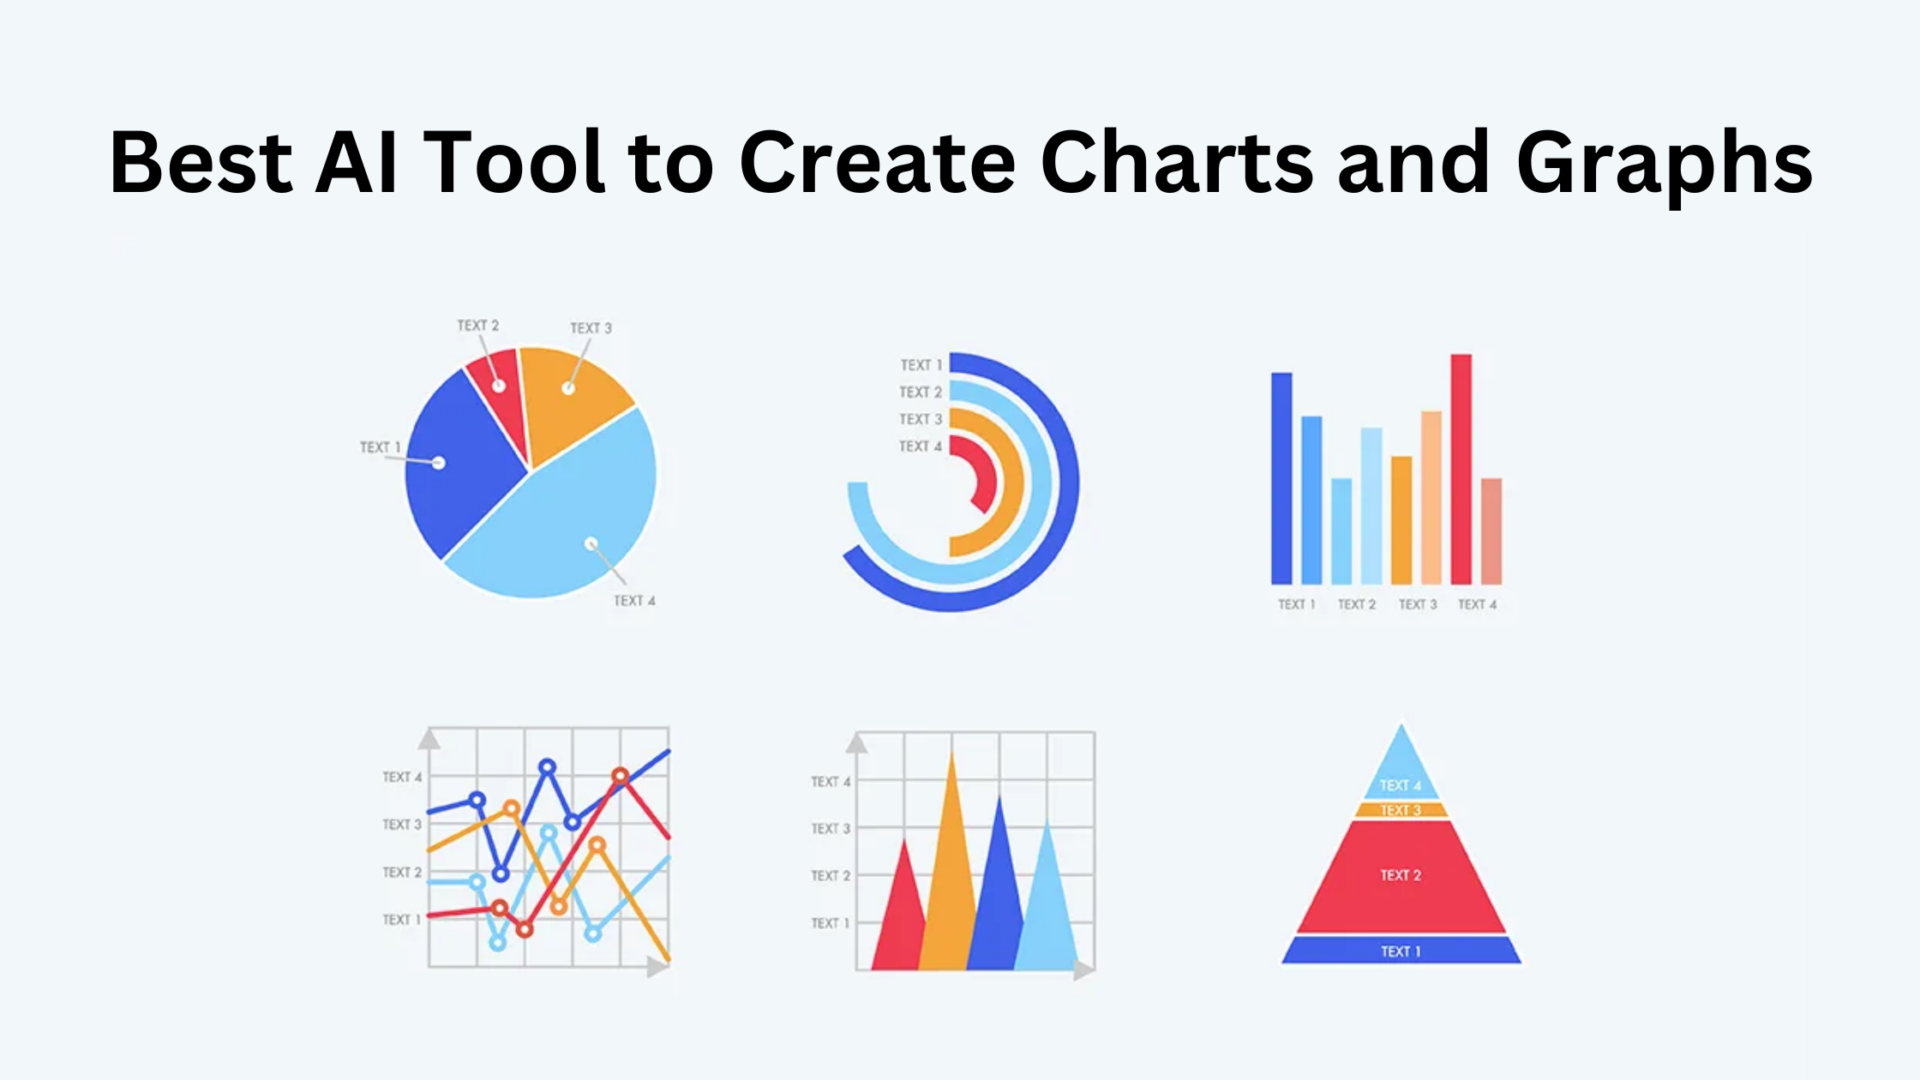
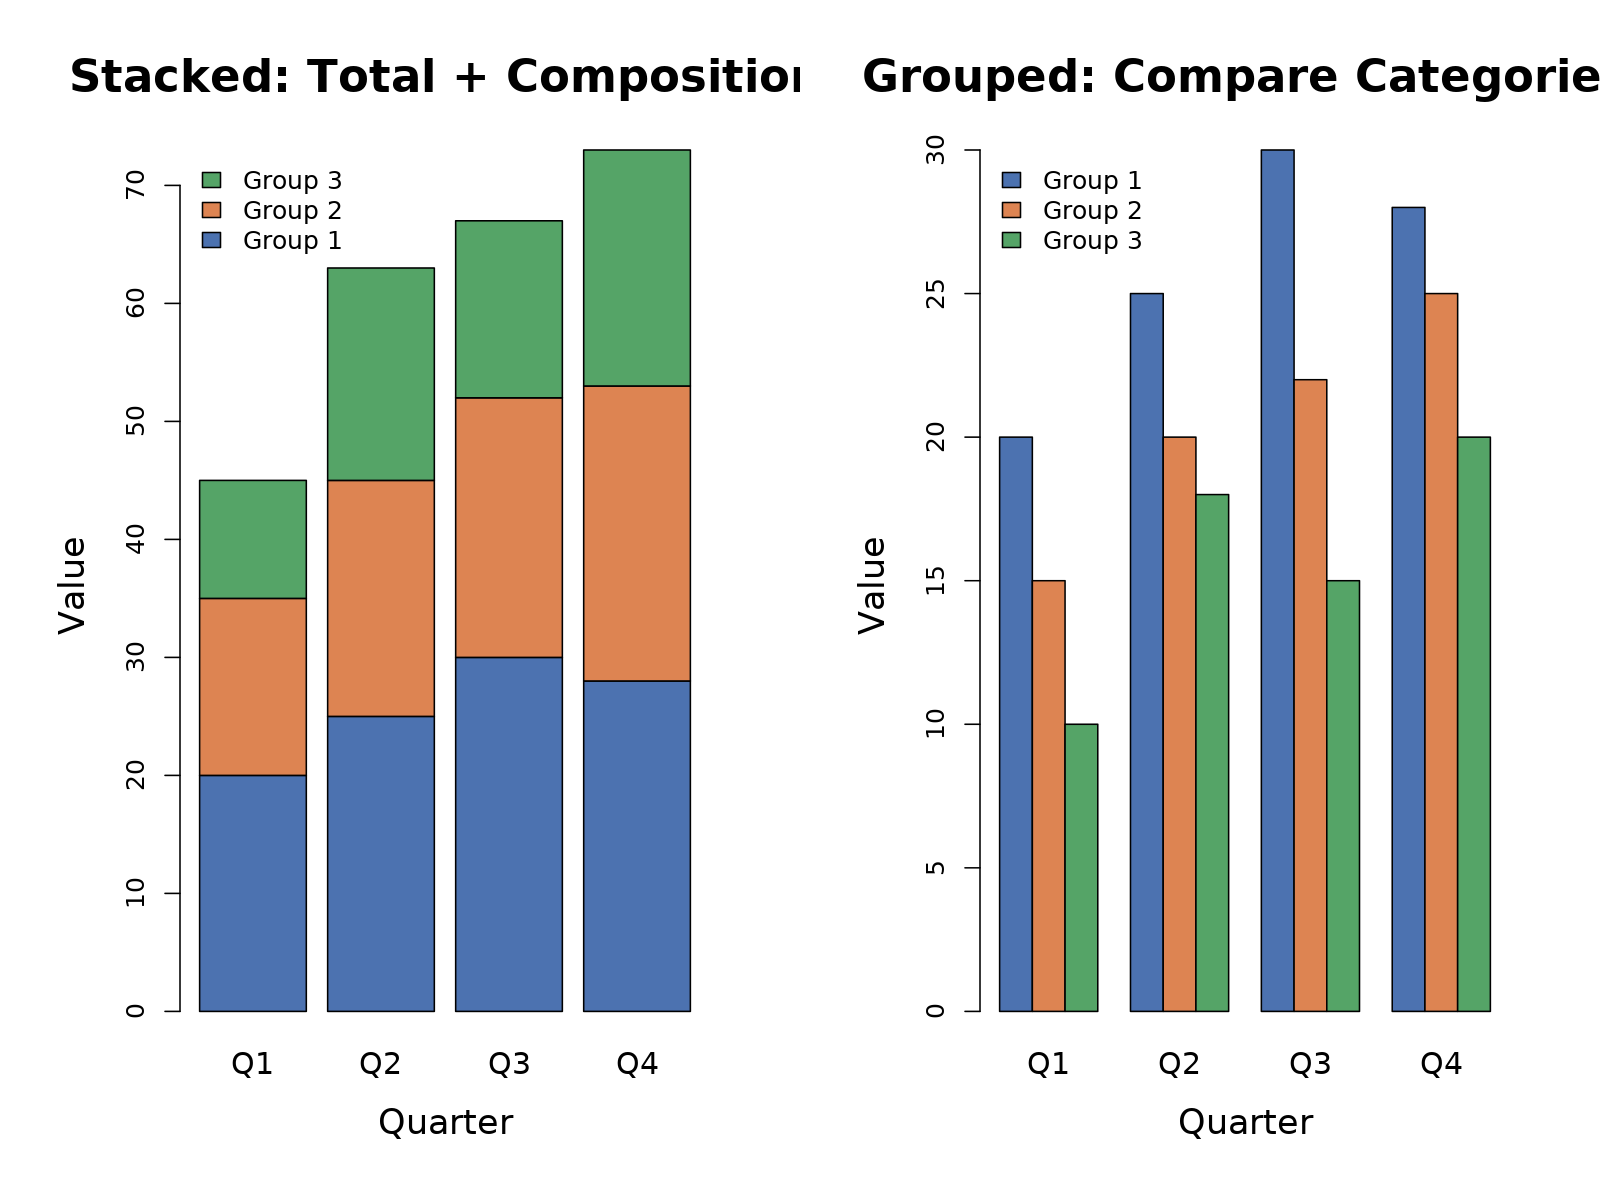
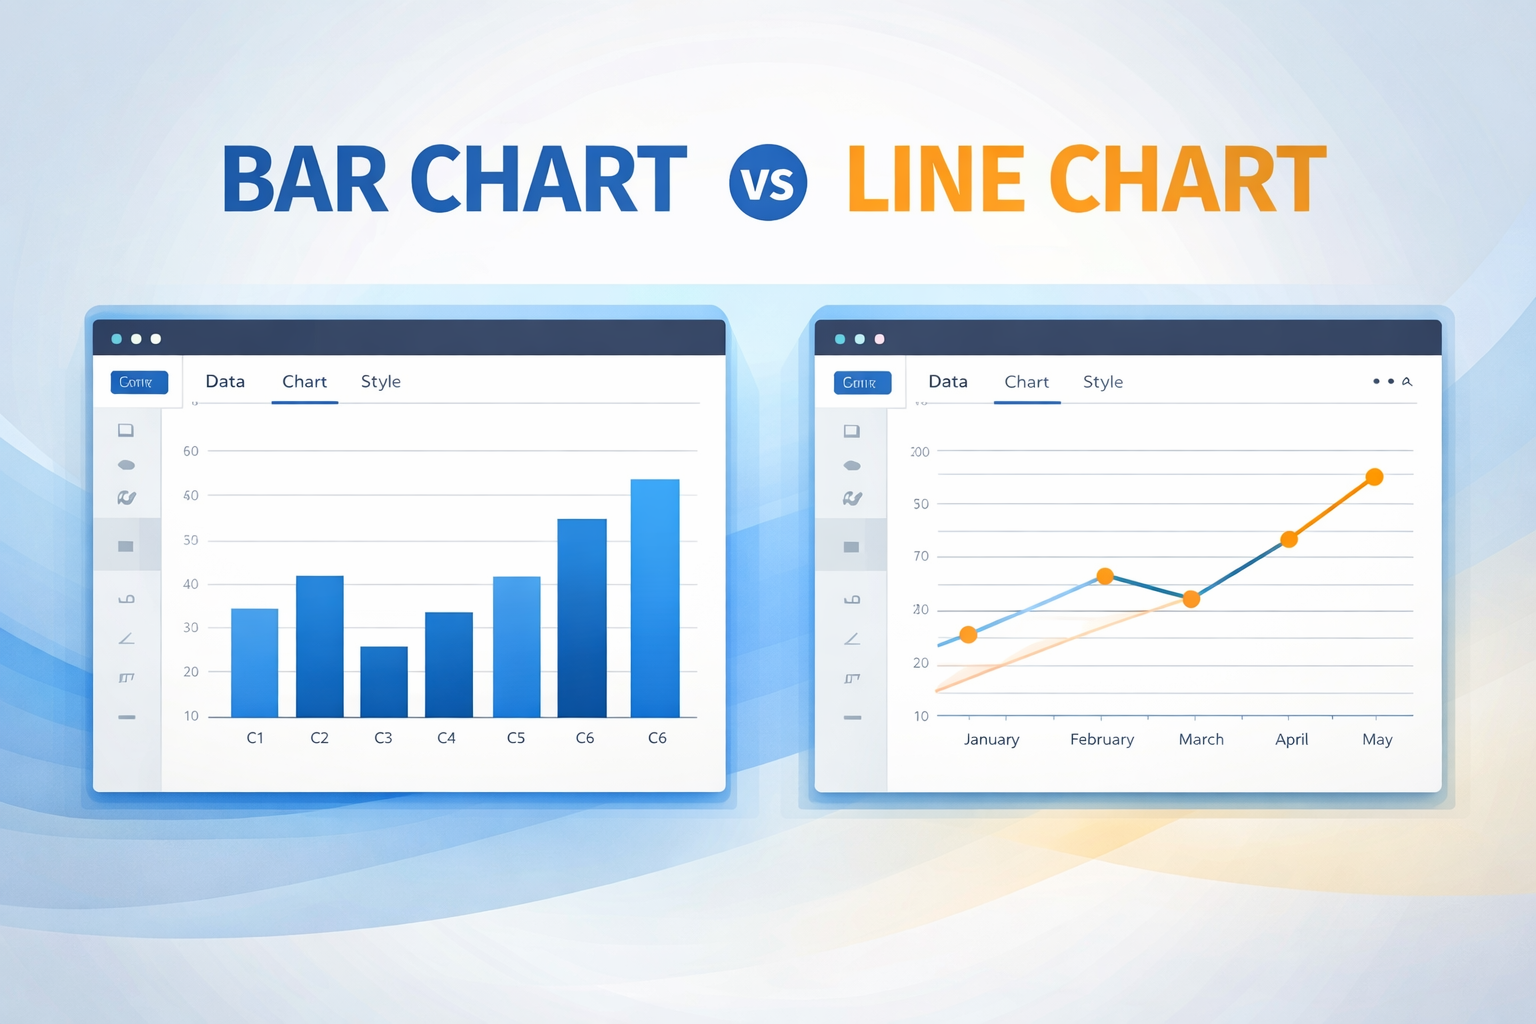
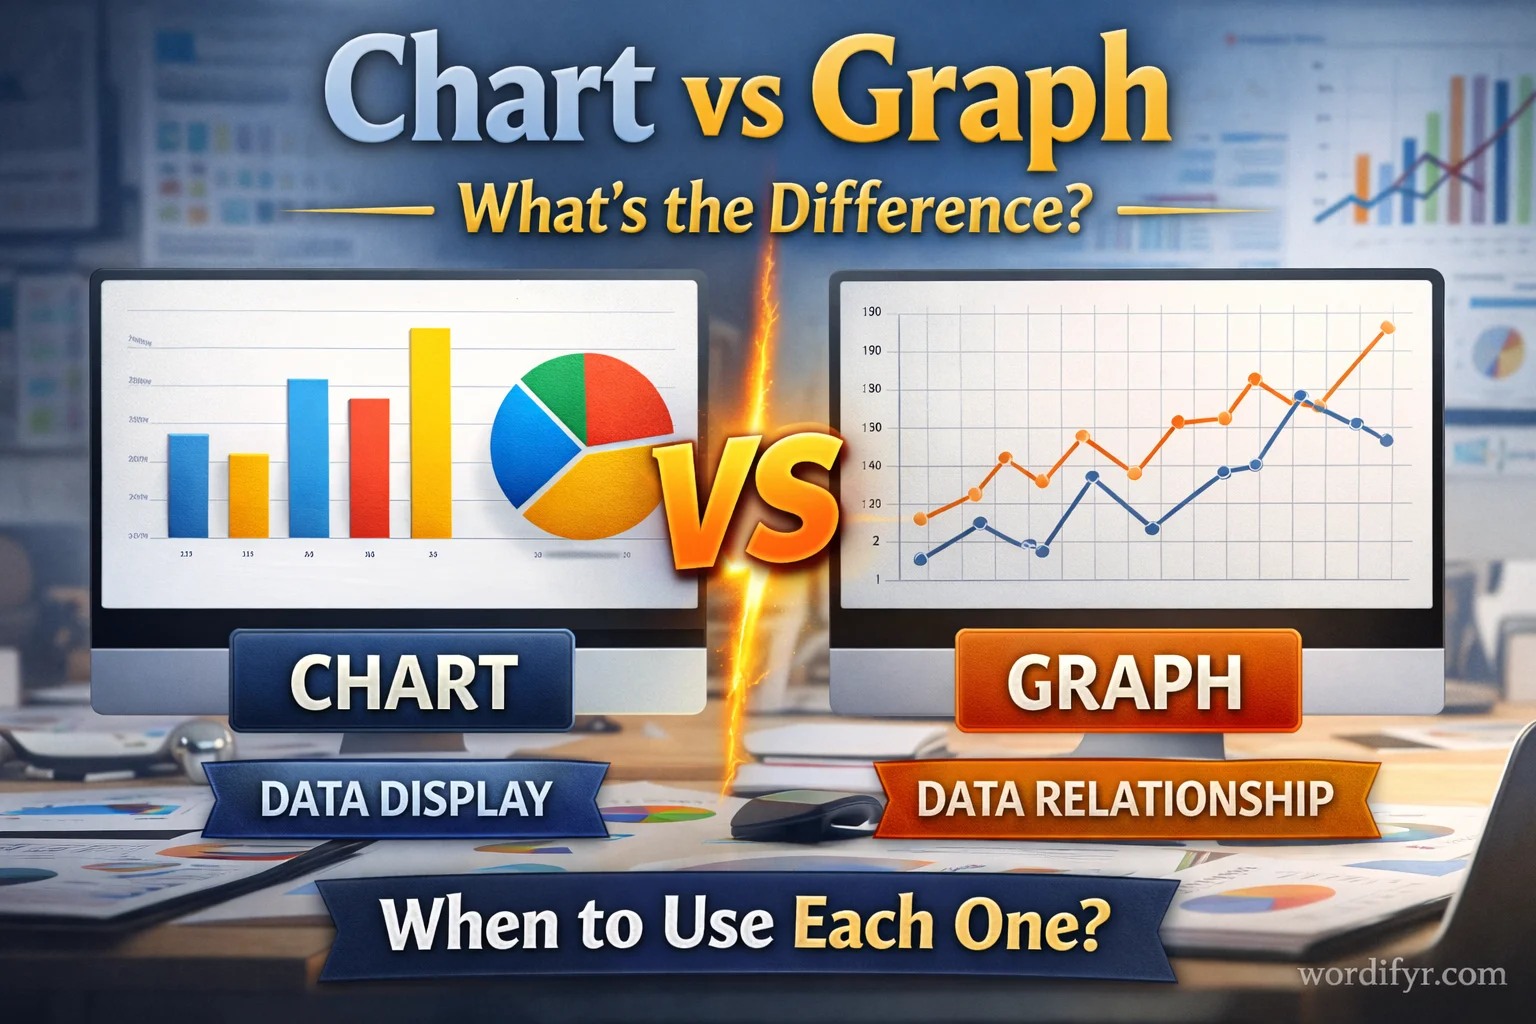
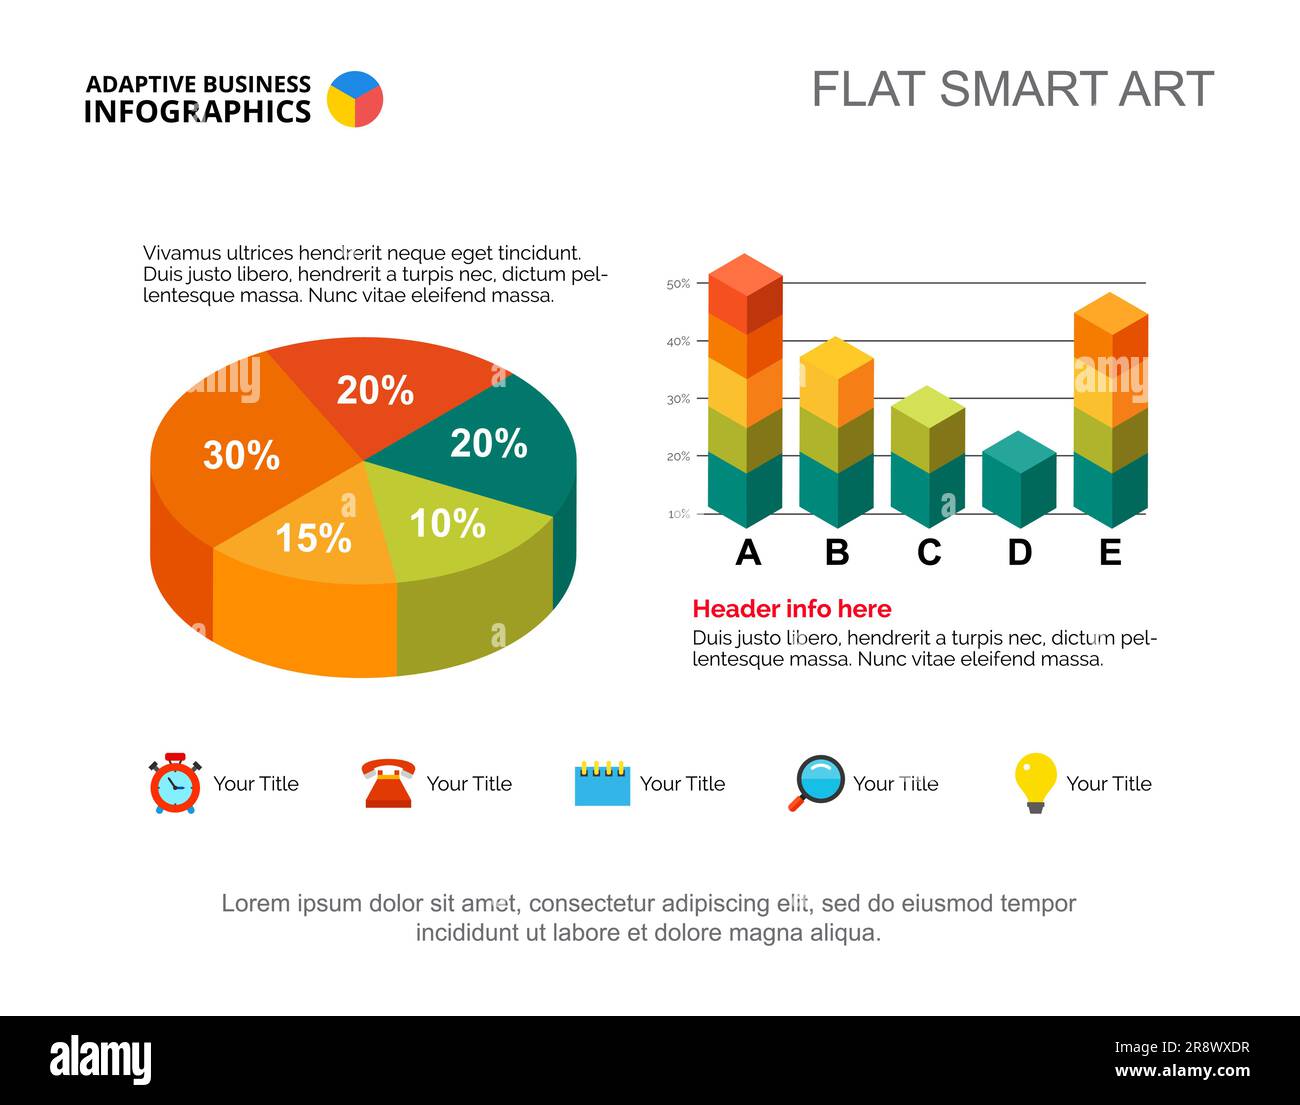
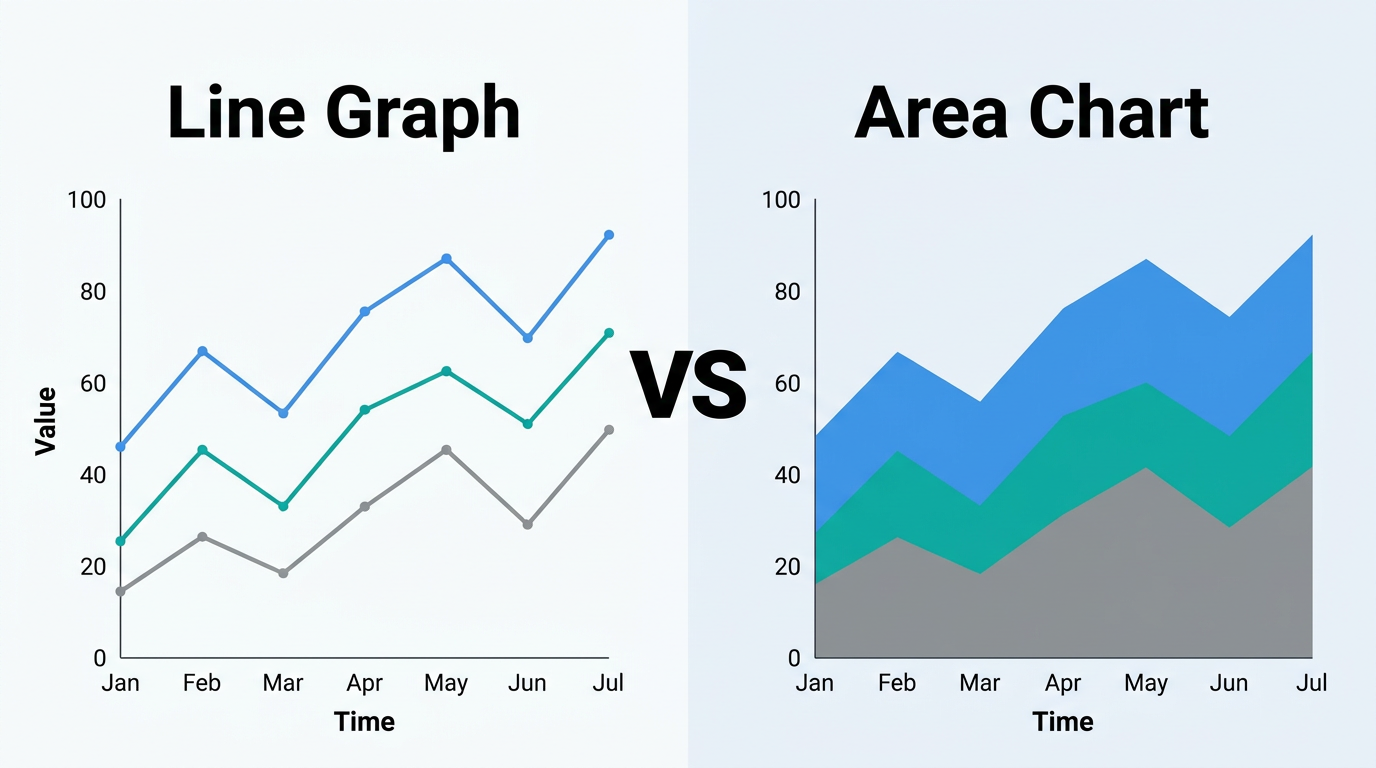
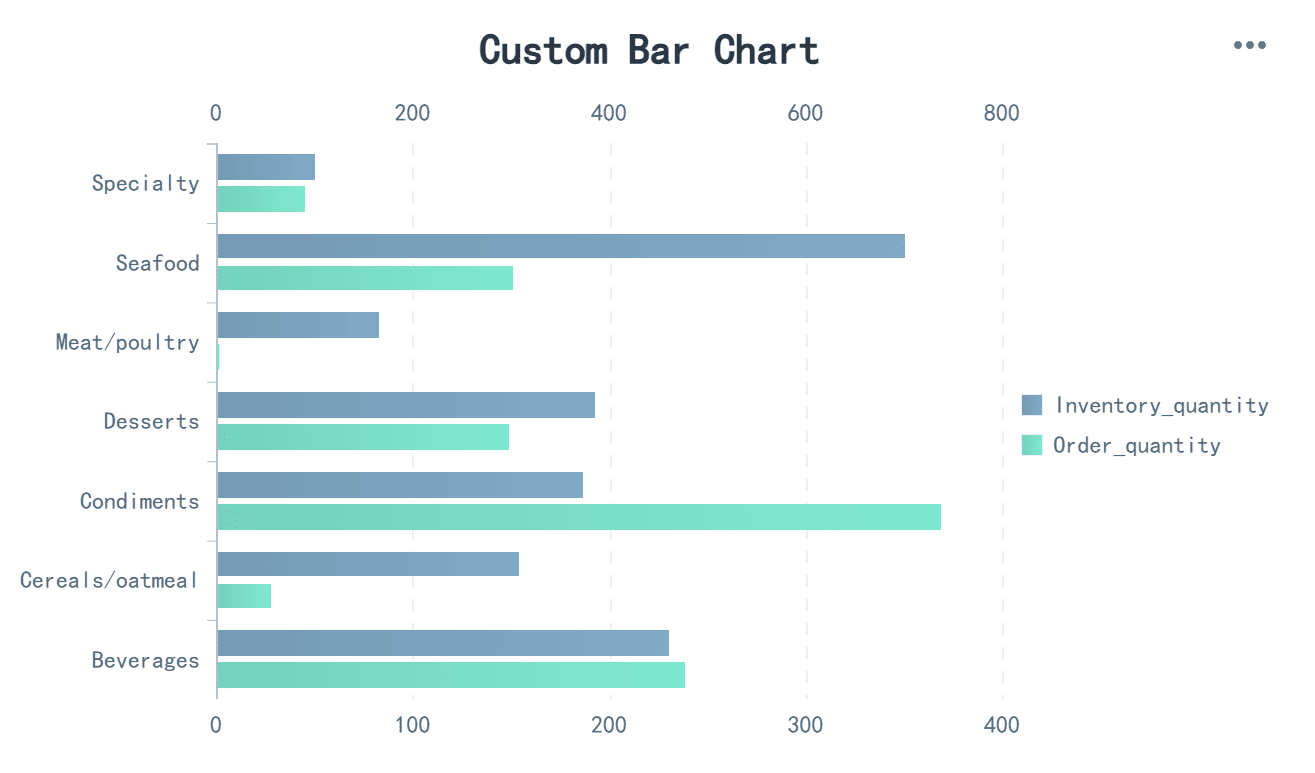
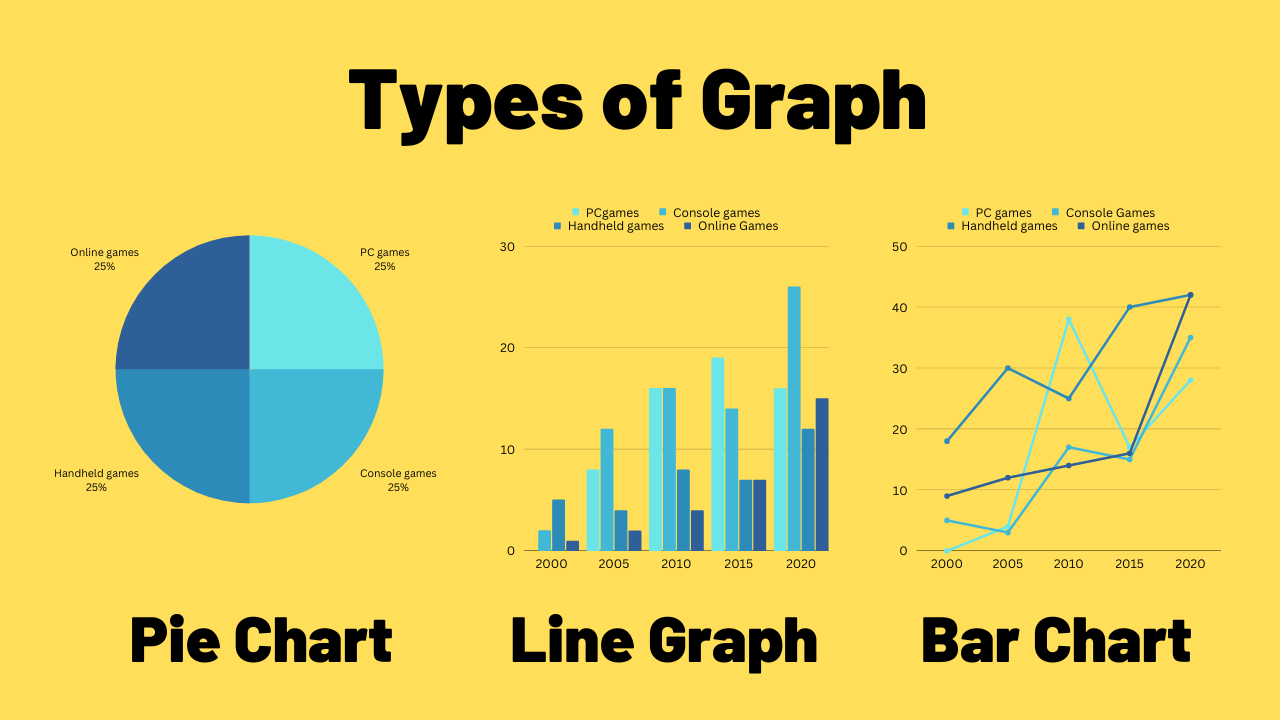
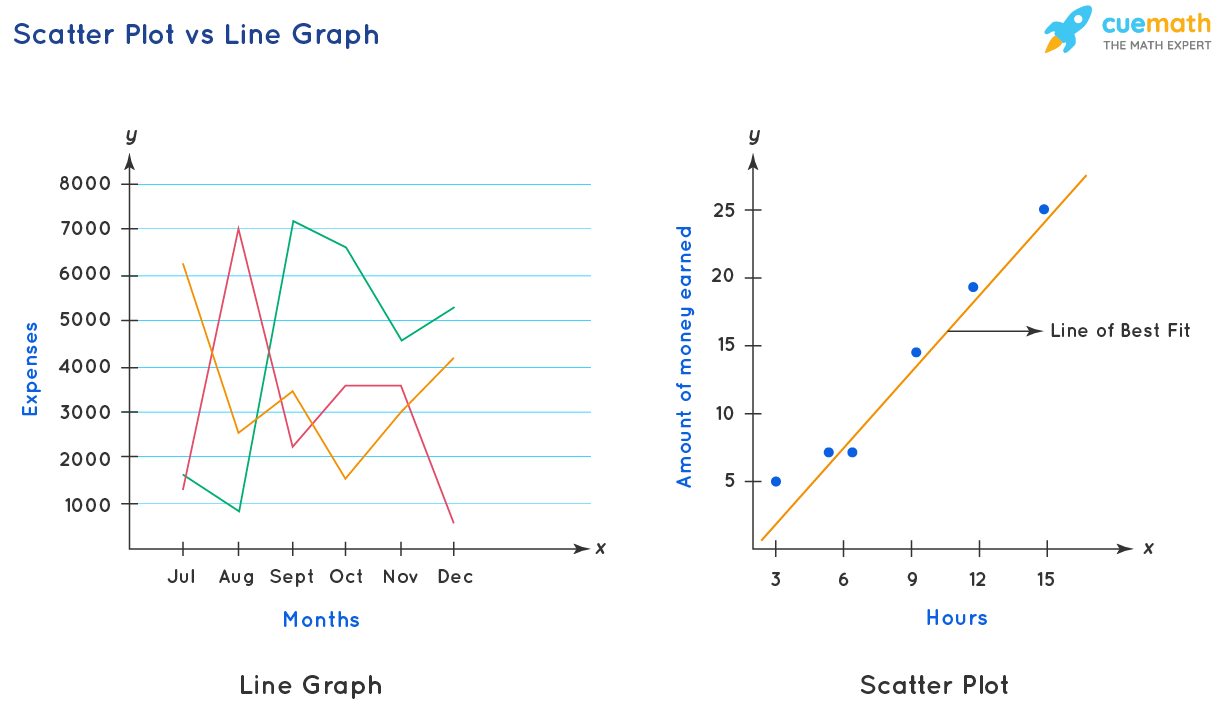
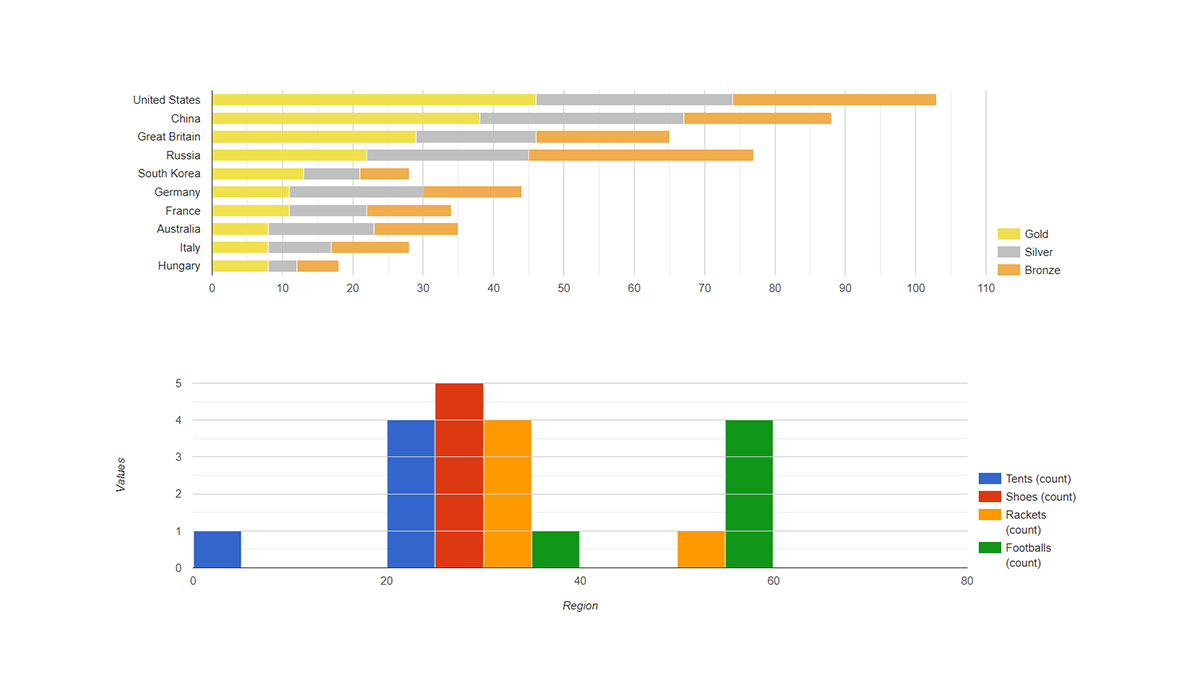
Charts and graphs are visual tools, but they each have their unique strengths. Charts, like bar charts or pie charts, are often used to compare values or show proportions. Graphs, on the other hand, including line graphs and scatter plots, are great for tracking changes and trends over time. Keep in mind, the type you choose may vary depending on your data and the story you want to tell.
Charts vs Graphs: Understanding the Difference
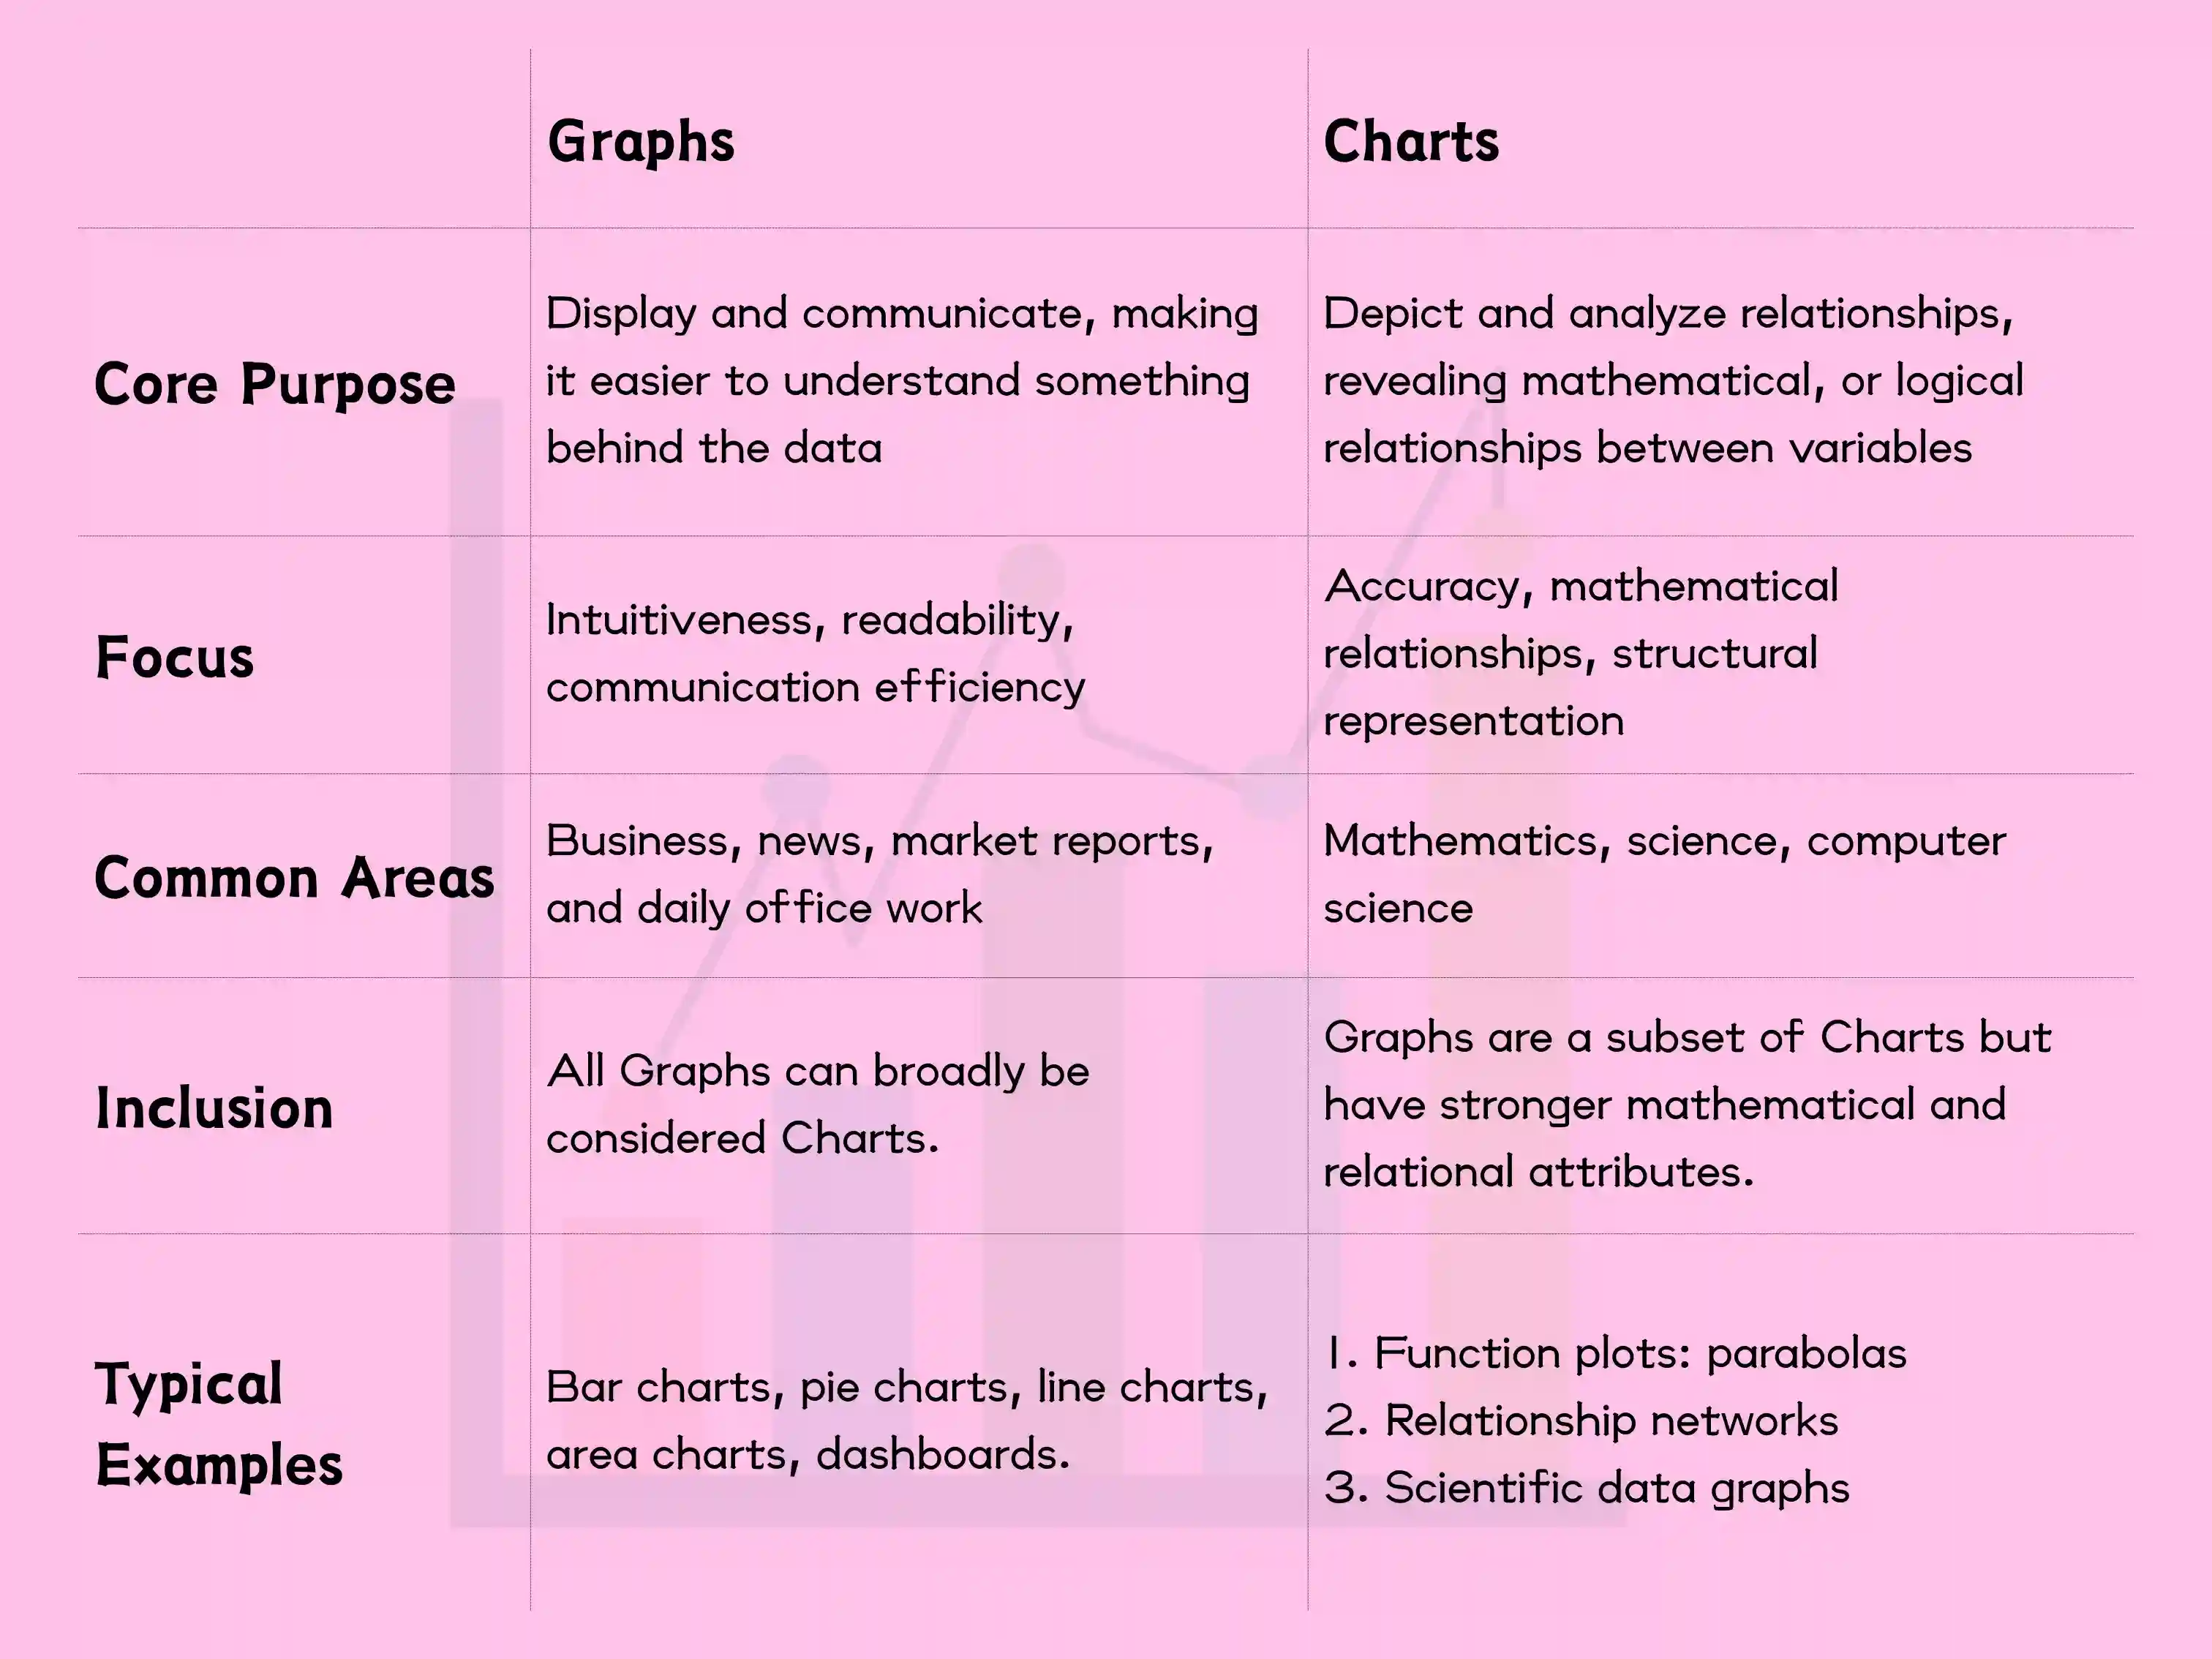
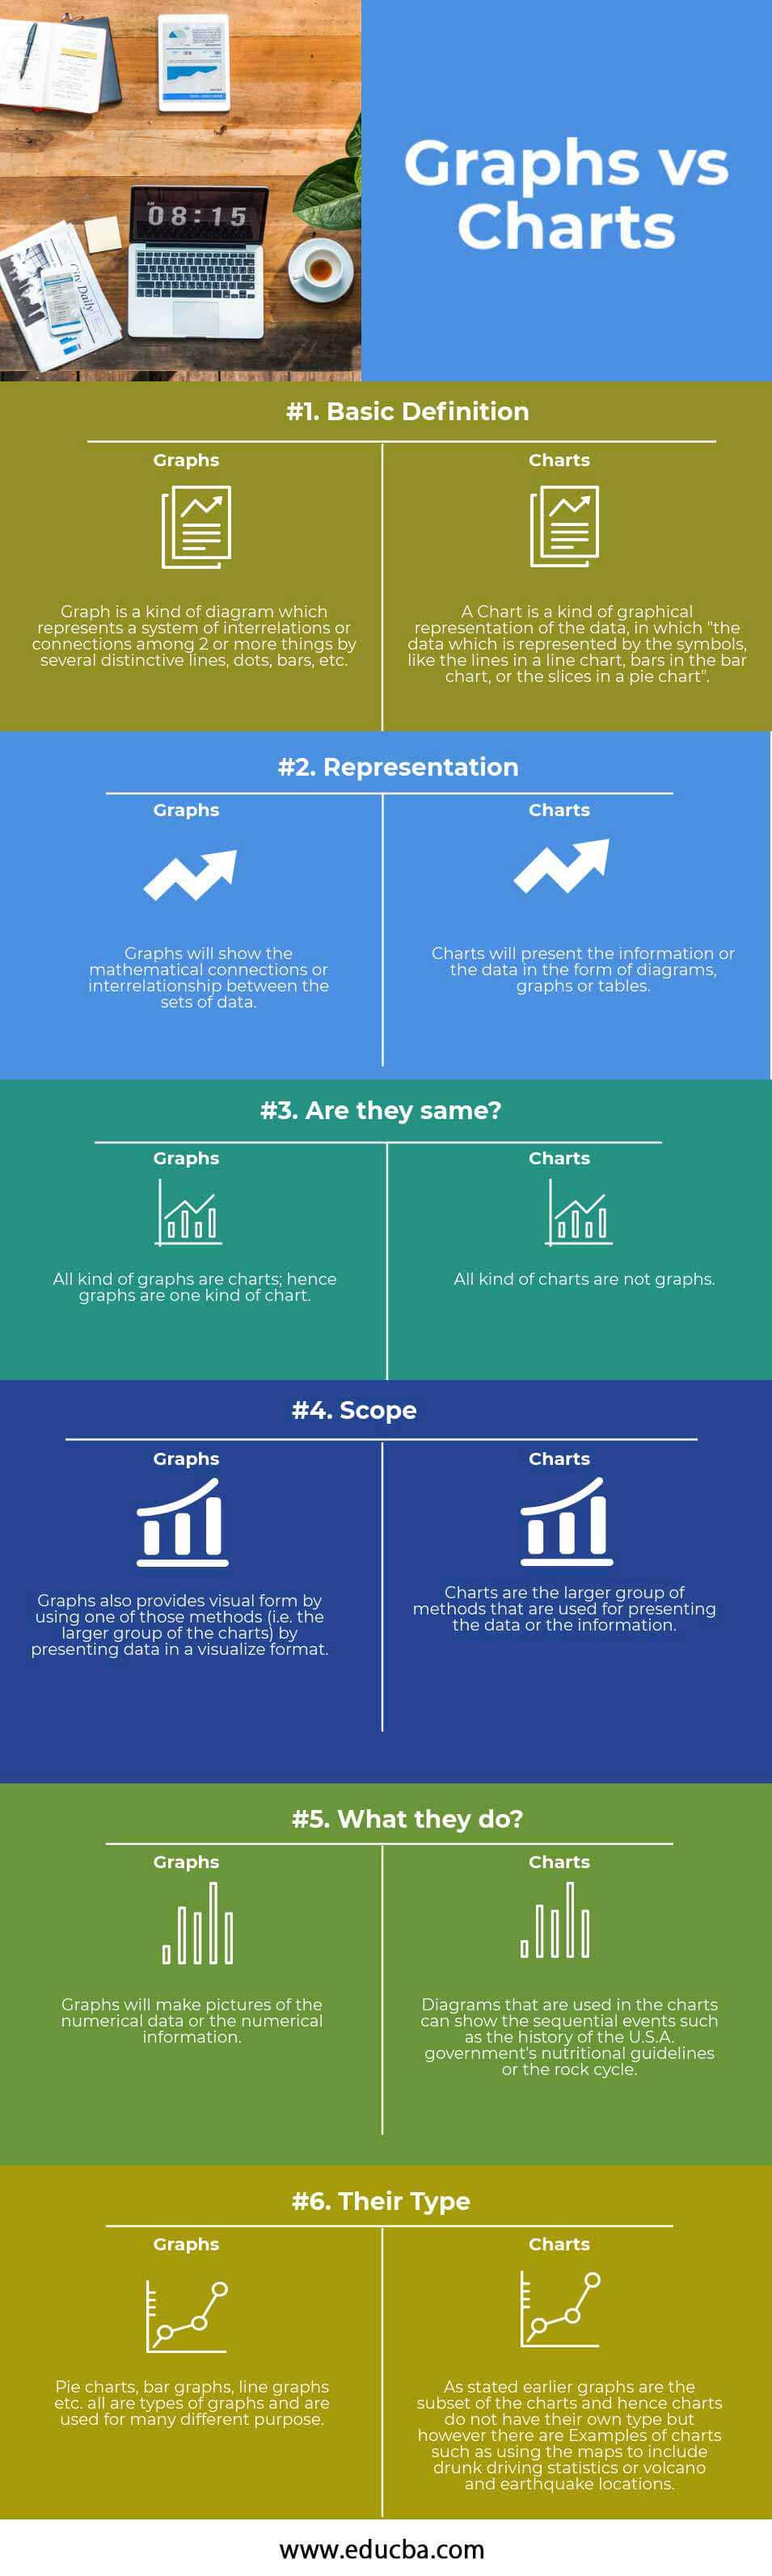
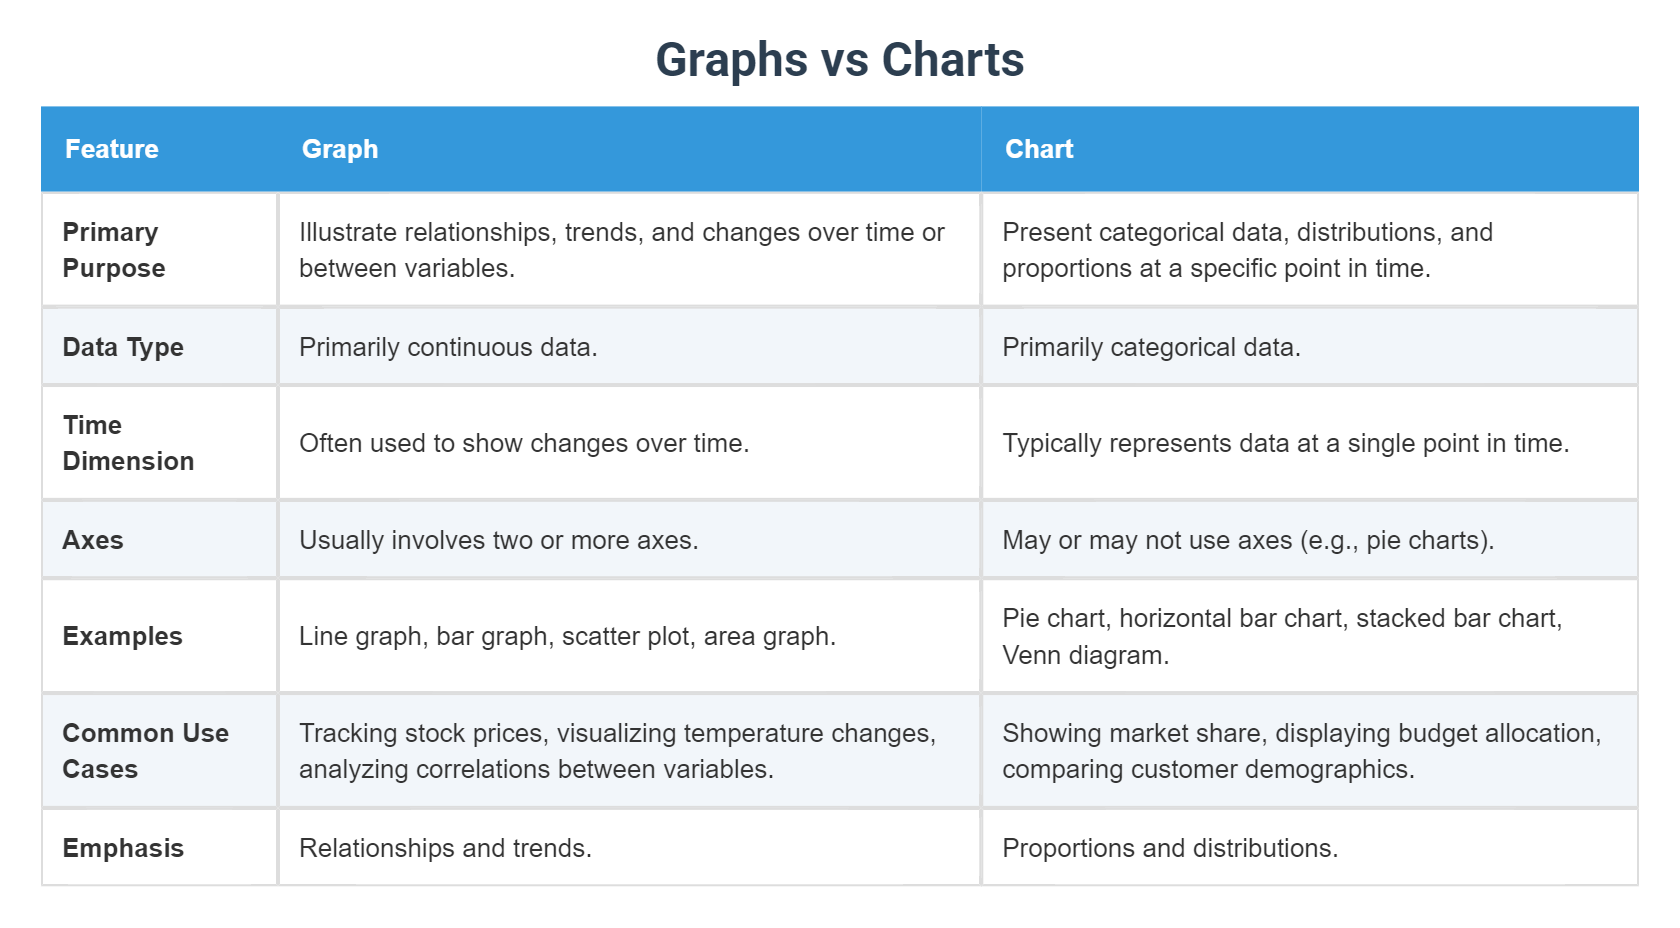
Charts vs graphs are two common ways to visualize data, but they serve different purposes and have unique features. Understanding the distinction is key to choosing the right tool for your data presentation. Charts are ideal for comparing categories or showing parts of a whole, while graphs excel at tracking changes over time or showing relationships between variables.
Key Details: Categories and Units
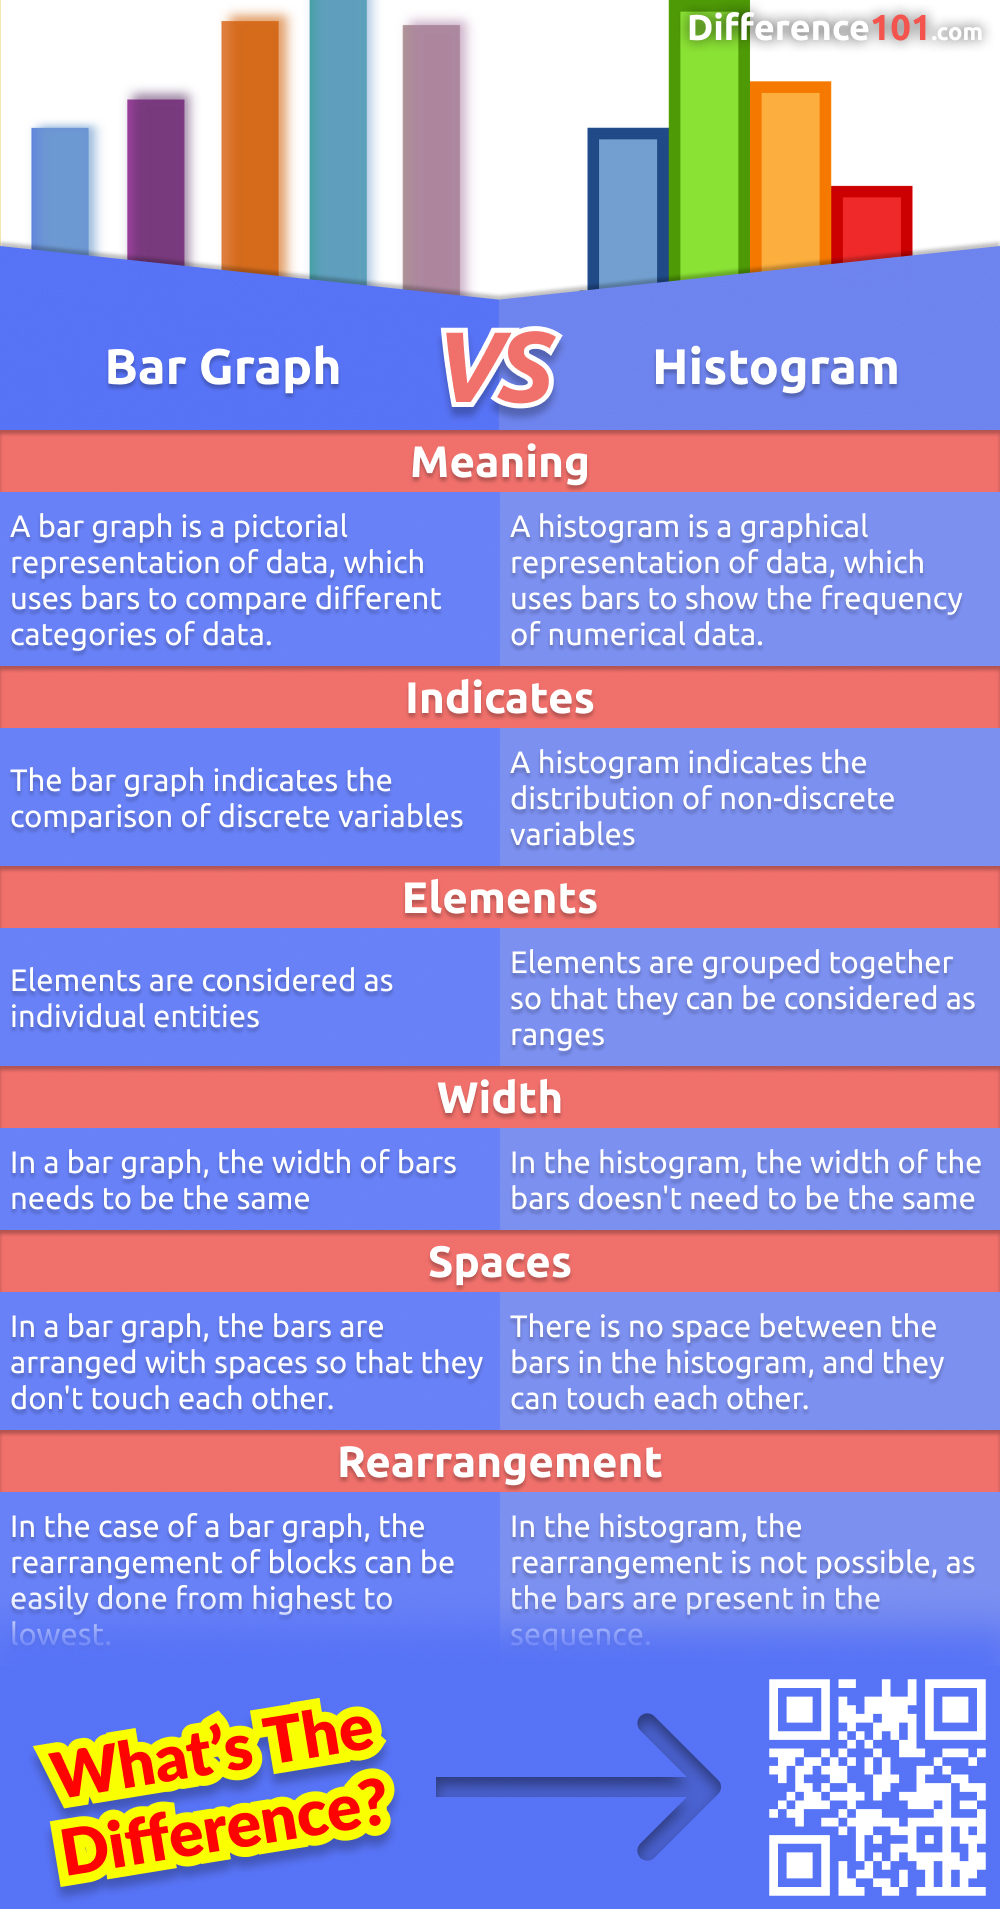
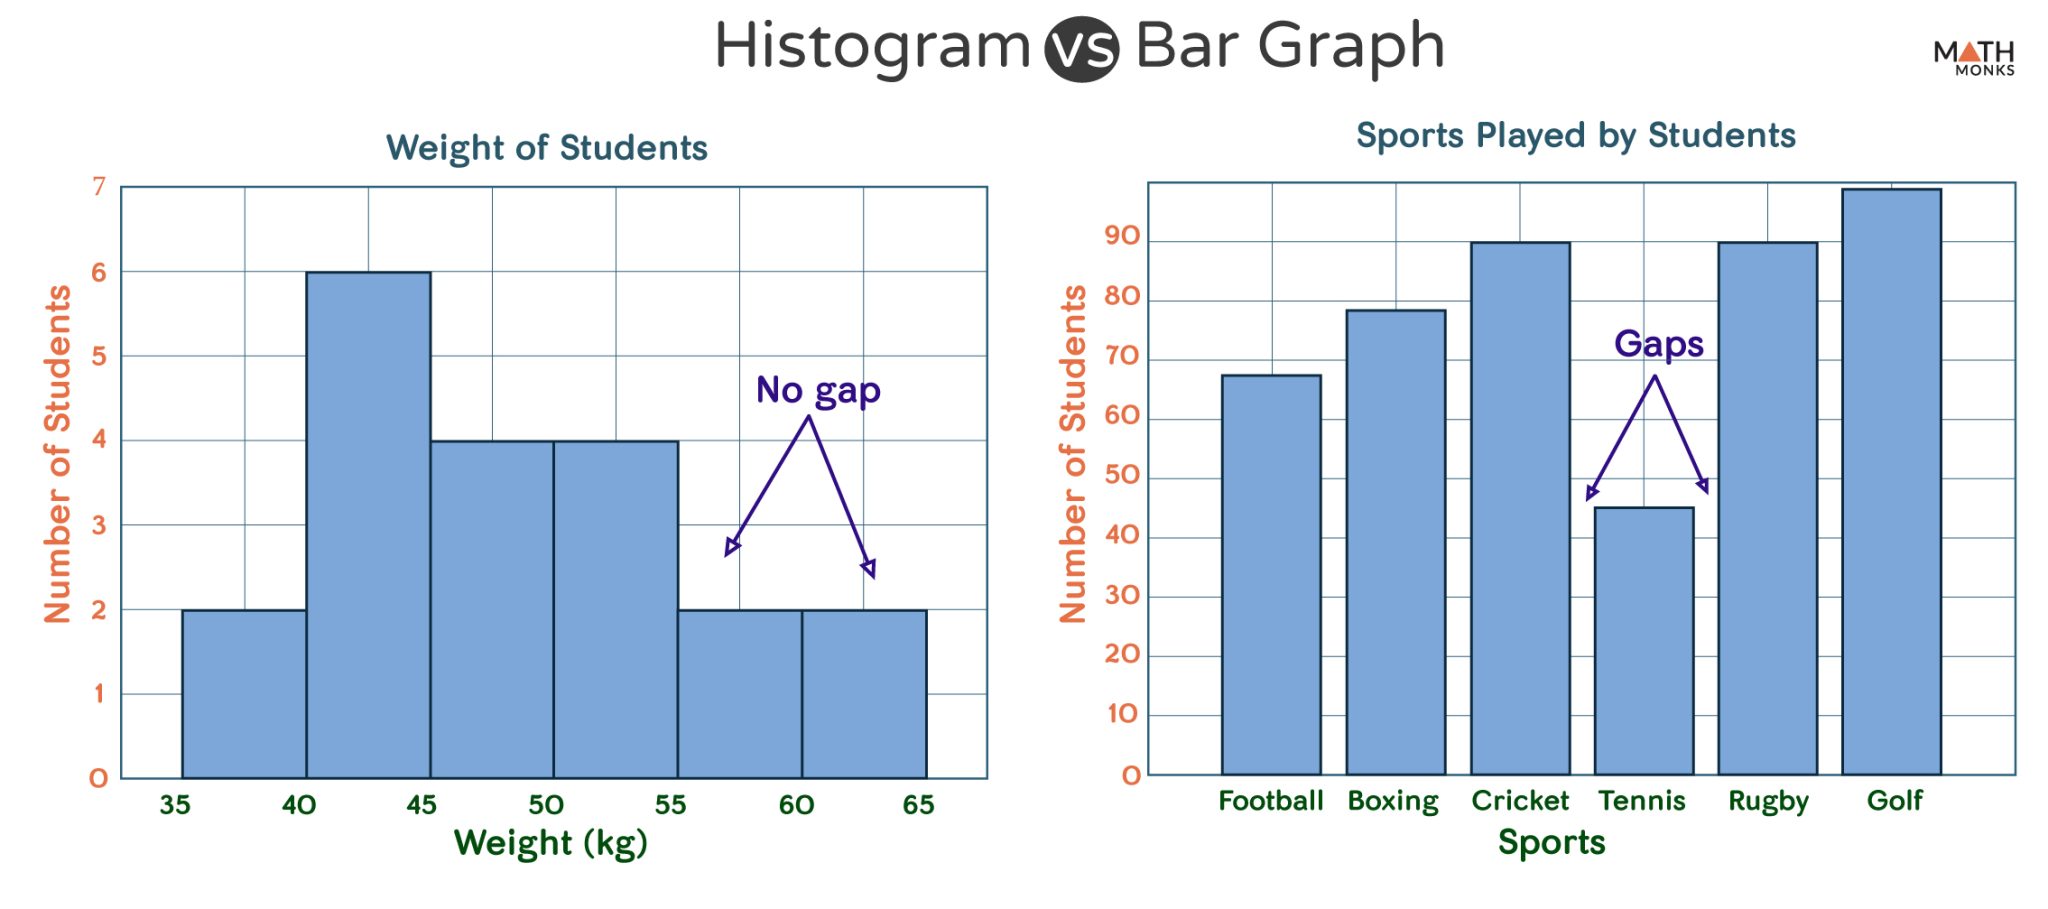
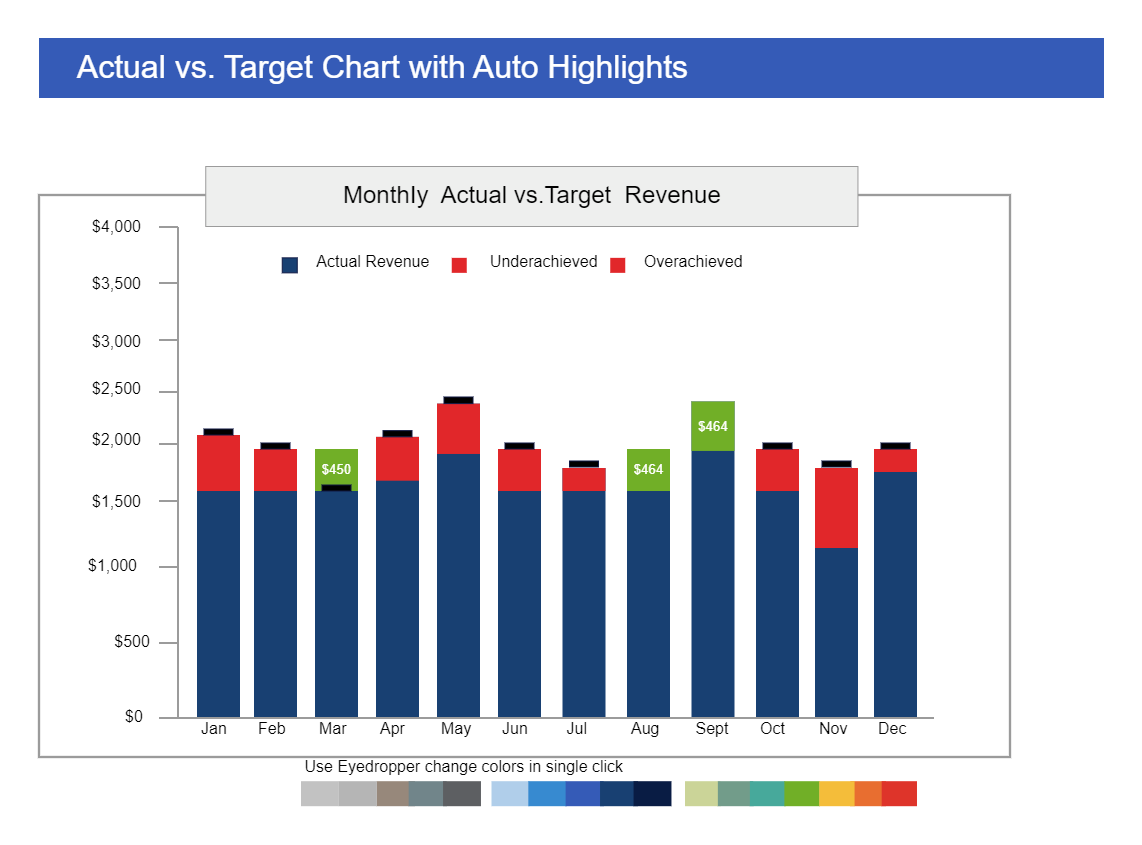
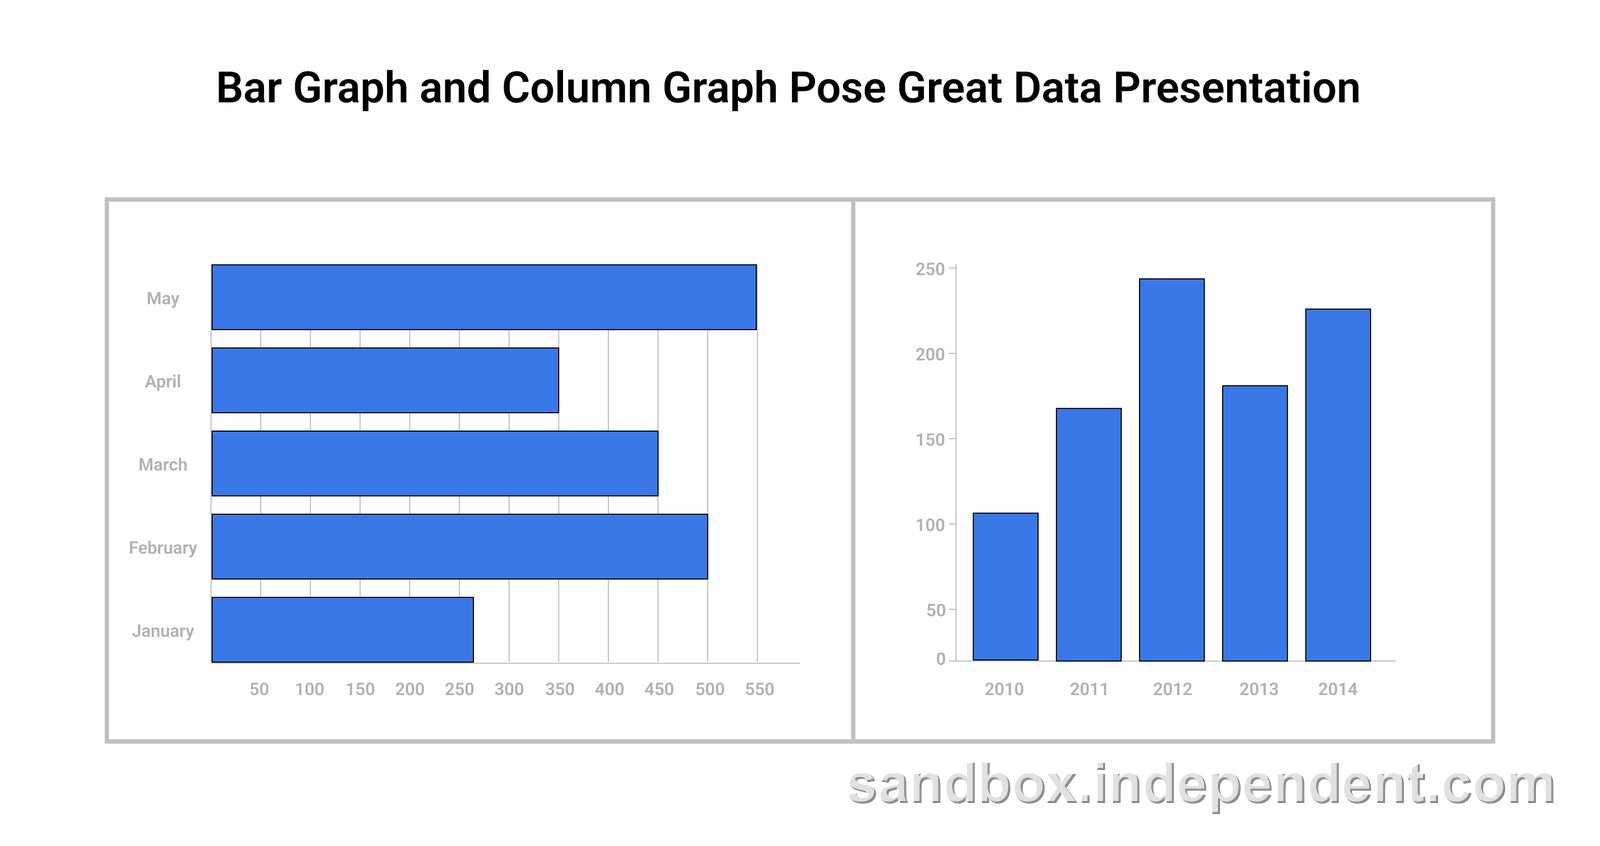
Charts typically display categories or groups of data, often using bars, slices, or symbols. The categories are usually named or labeled along one axis, with the values or quantities represented visually. In contrast, graphs focus on numerical data, plotting values along two or more axes to show trends, patterns, or correlations. Common graph types include line graphs, scatter plots, and bar graphs.
How to Read and Apply: A Step-by-Step Guide
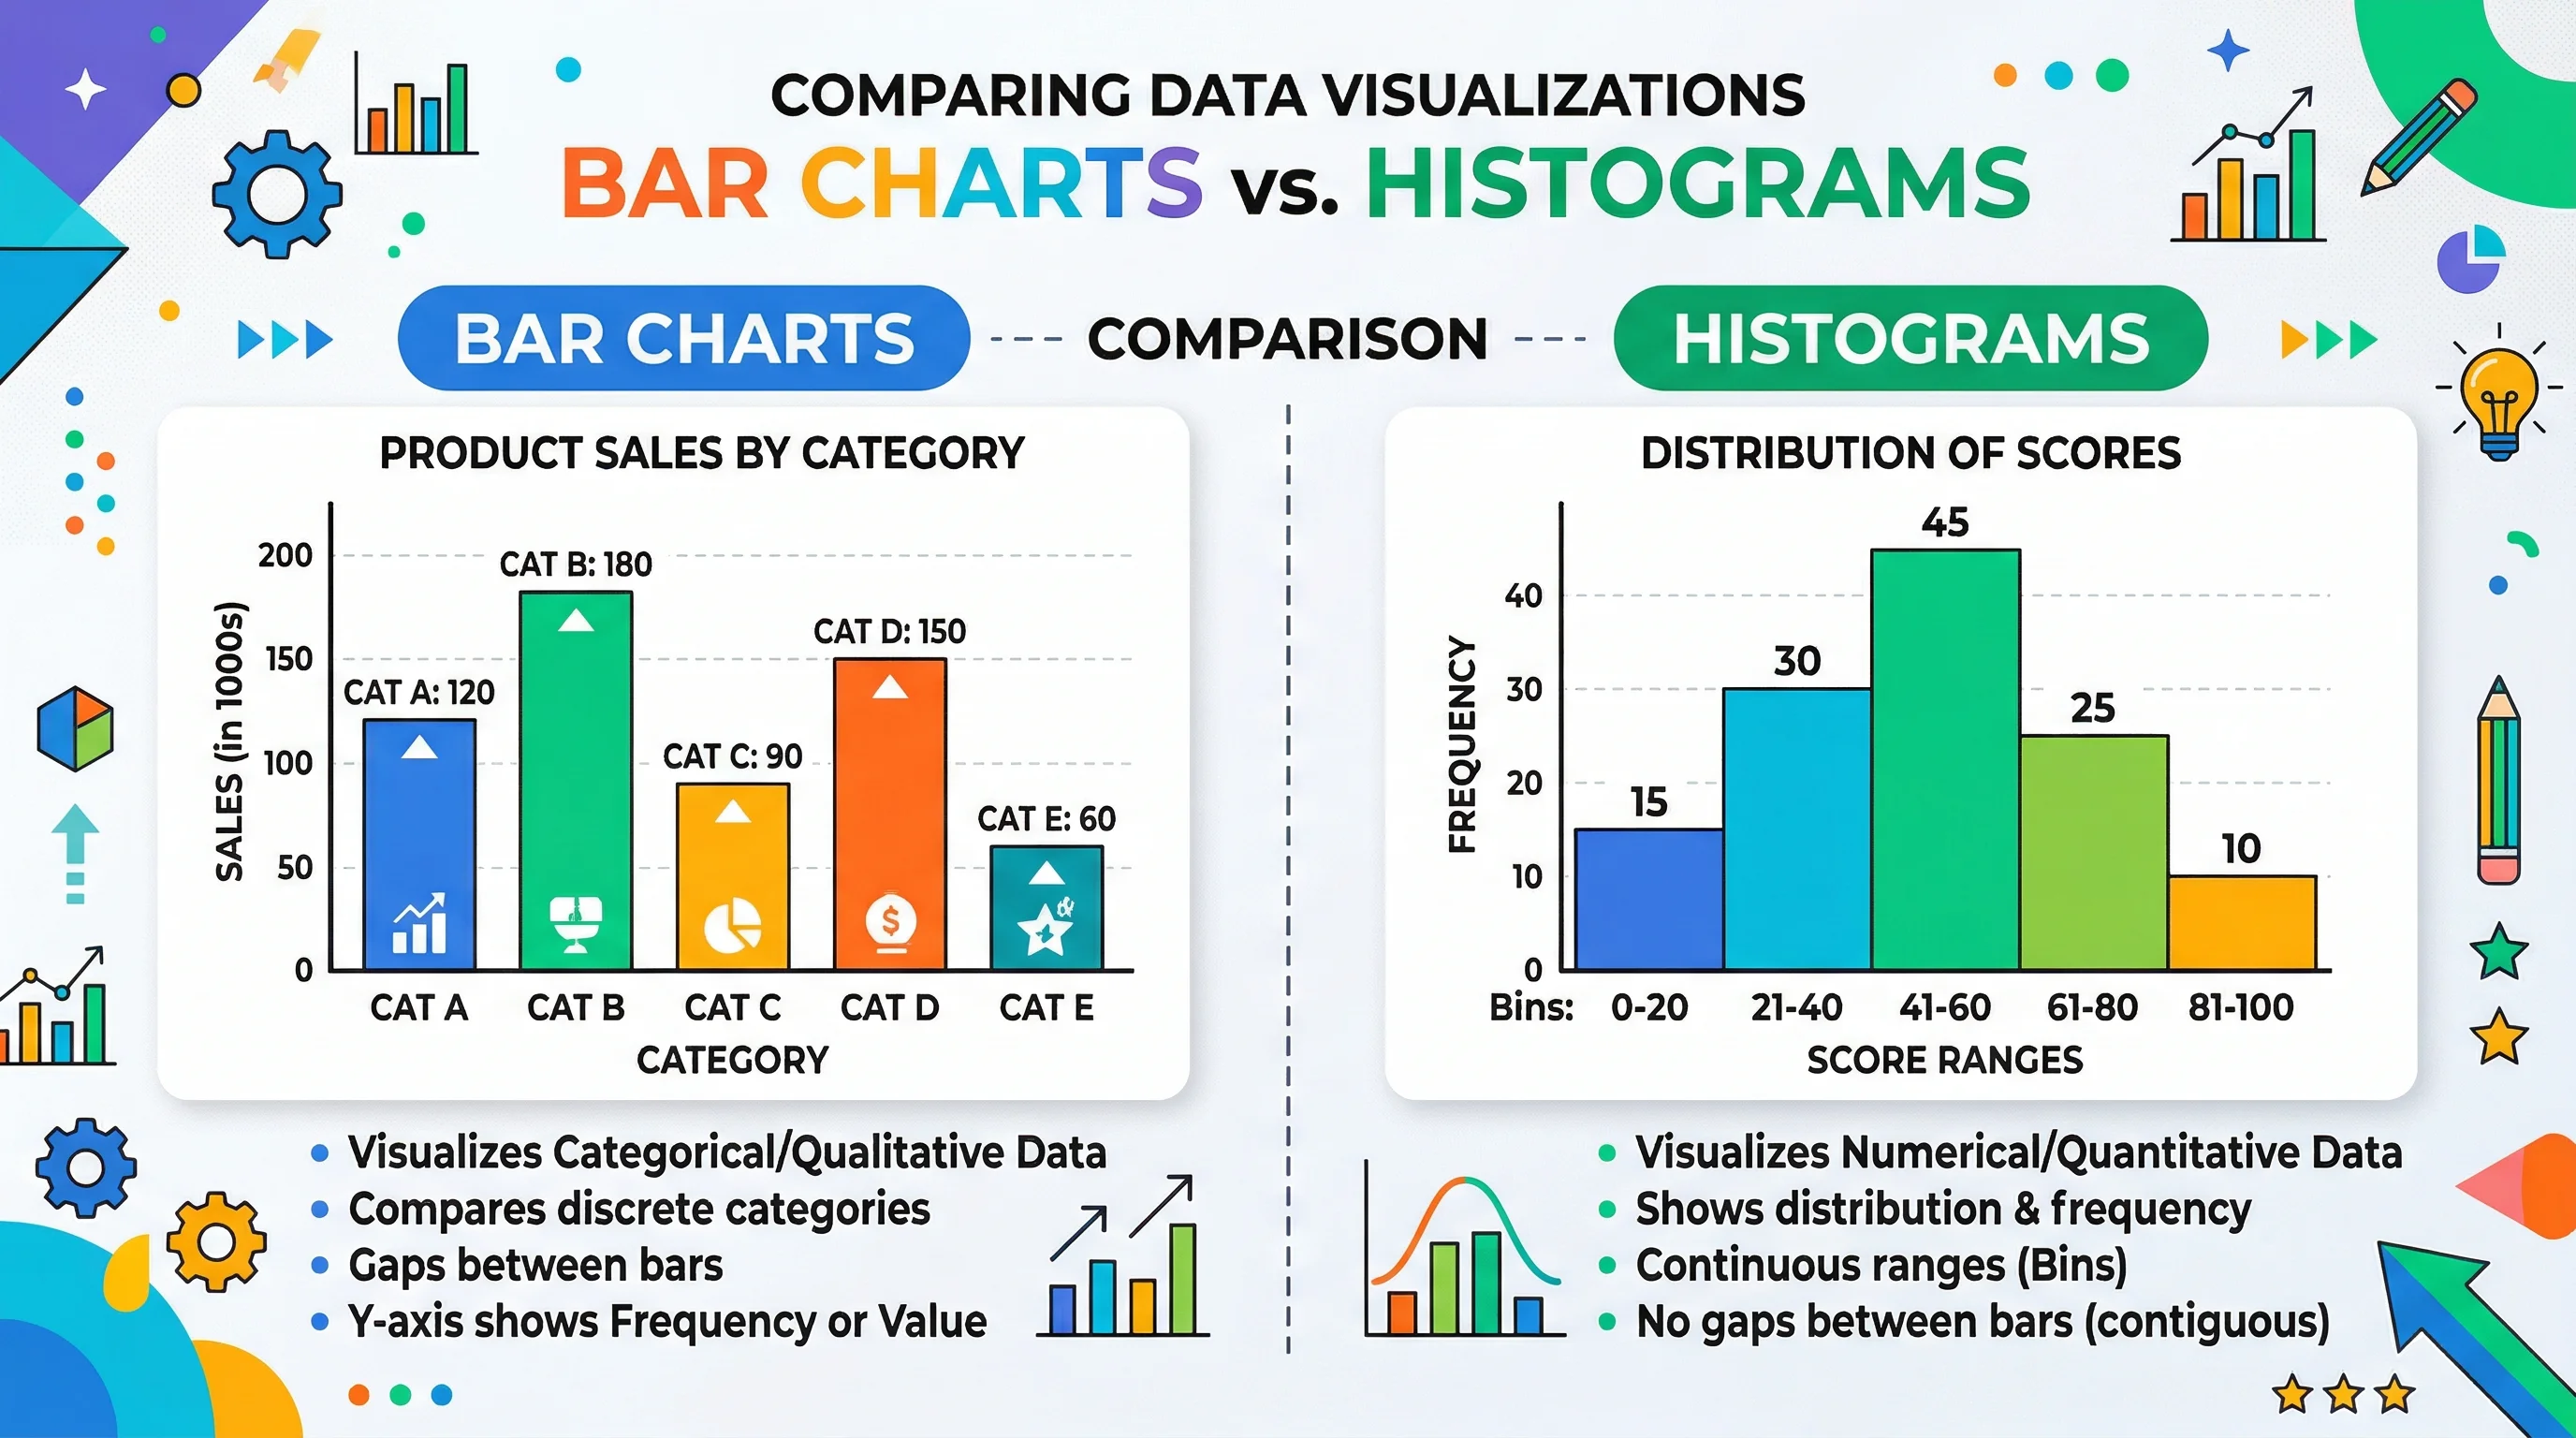
- Identify your data type: Is it categorical (e.g., types of fruit) or numerical (e.g., sales figures)? This choice guides your visualization.
- Choose the right format: For categorical data, consider a bar chart or pie chart. For numerical data with trends, line graphs are great. Scatter plots work well for showing relationships between two variables.
- Label your axes: Clearly label what each axis represents. For charts, label the categories and their values. For graphs, label the variables and their units.
- Interpret the visual: Look for patterns, outliers, or trends. Compare categories or track changes over time. Consider the scale and any anomalies.
- Communicate your insights: Use the visualization to tell a story or make a point. Highlight key findings and ensure your audience can easily understand the message.
Variations and Differences: When and Why
The choice between charts and graphs depends on your data and purpose. Charts are ideal for comparing categories or showing proportions, especially when you want a simple, easy-to-read visual. Graphs are better for tracking changes, identifying trends, or showing cause-and-effect relationships. The data type and context guide your decision:
- Charts vs graphs can vary based on the standard or region. For instance, some charts use percentages, while others show raw values. Always check the specific standard or guidelines for your industry or region.
- The data itself may dictate the choice. For example, time-series data often calls for a line graph, while comparing budget allocations might use a pie chart.
- The audience and purpose matter too. Simple bar charts are great for quick comparisons, while more complex scatter plots may be needed for scientific or statistical analysis.
Common Mistakes and How to Avoid Them
- Misinterpreting the data: Always ensure you understand the units, scale, and context. Don't assume trends or correlations without checking the underlying data.
- Using the wrong visualization: Choose the right chart type for your data. Don't force a line graph for categorical data or a pie chart for time-series data.
- Over-complicating: Keep it simple. Avoid unnecessary details or clutter. Focus on clarity and ensuring the key message is easy to grasp.
- Inaccurate labeling: Clearly label axes, categories, and units. Inconsistent or missing labels can lead to confusion.
- Ignoring context: Consider the audience and purpose. Tailor your visualization to meet their needs and ensure it aligns with the data story you want to tell.
Charts and graphs are powerful tools, and now you've got the hang of them! Remember, the key is to choose the right visual for your data, and always consider your audience and the message you want to convey.
It's easy to get caught up in the details, but don't forget to step back and assess your specific needs. Double-check your context and requirements to ensure you're on the right track. This guide should be a handy reference, so feel free to bookmark it for future use! It's a quick and easy way to refresh your memory and ensure your charts and graphs are always on point.
Images