Uncover the Secrets of the Price Charting App
Dive into our guide on the price charting app. Learn how to read and interpret charts, gain clear reference values, and discover practical tips to make the most of this powerful tool.
Many beginners in the world of finance and trading often overlook the power of visual tools, assuming they are complex and intimidating. However, a price charting app is your friendly companion, offering a simple yet effective way to understand market trends. It's not about deciphering a secret code; these apps provide an accessible gateway to interpreting historical price data and identifying patterns.
Understanding Price Charting: A Quick Overview
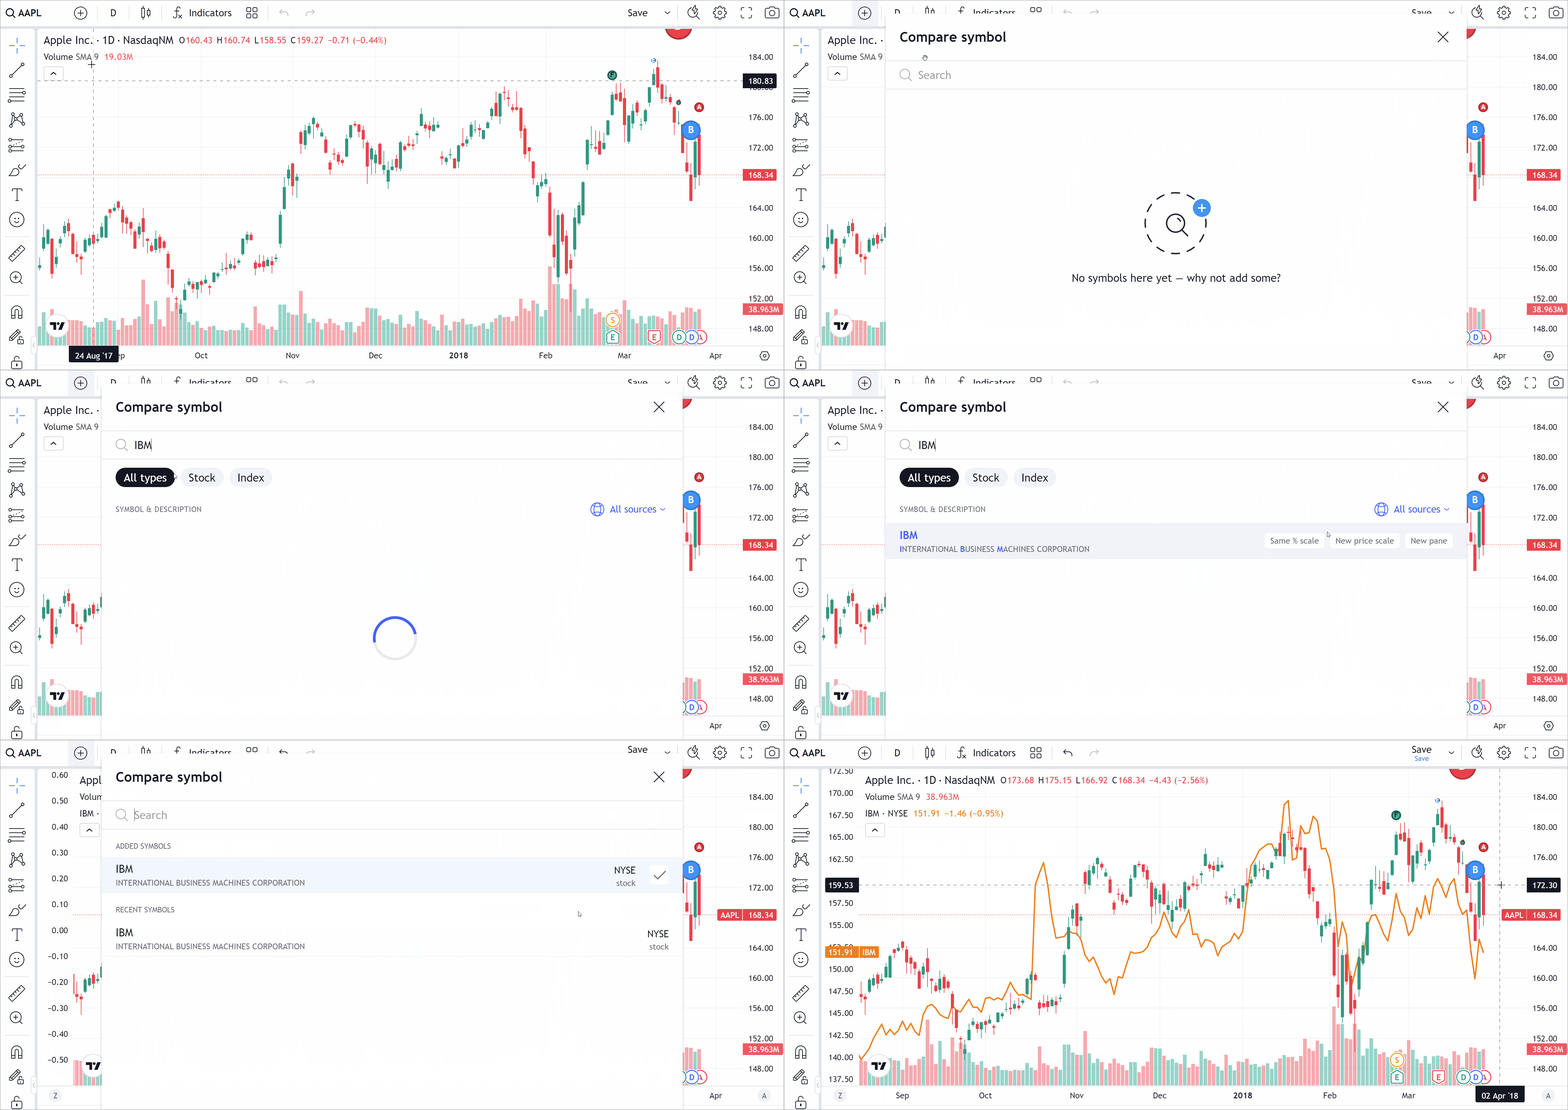
A price charting app is a powerful tool for anyone interested in stock market analysis and understanding historical price data. It provides a visual representation of price movements, helping investors and traders make informed decisions. This guide will walk you through the basics of reading and interpreting these charts.
Chart Types and Formats: Comparing the Options
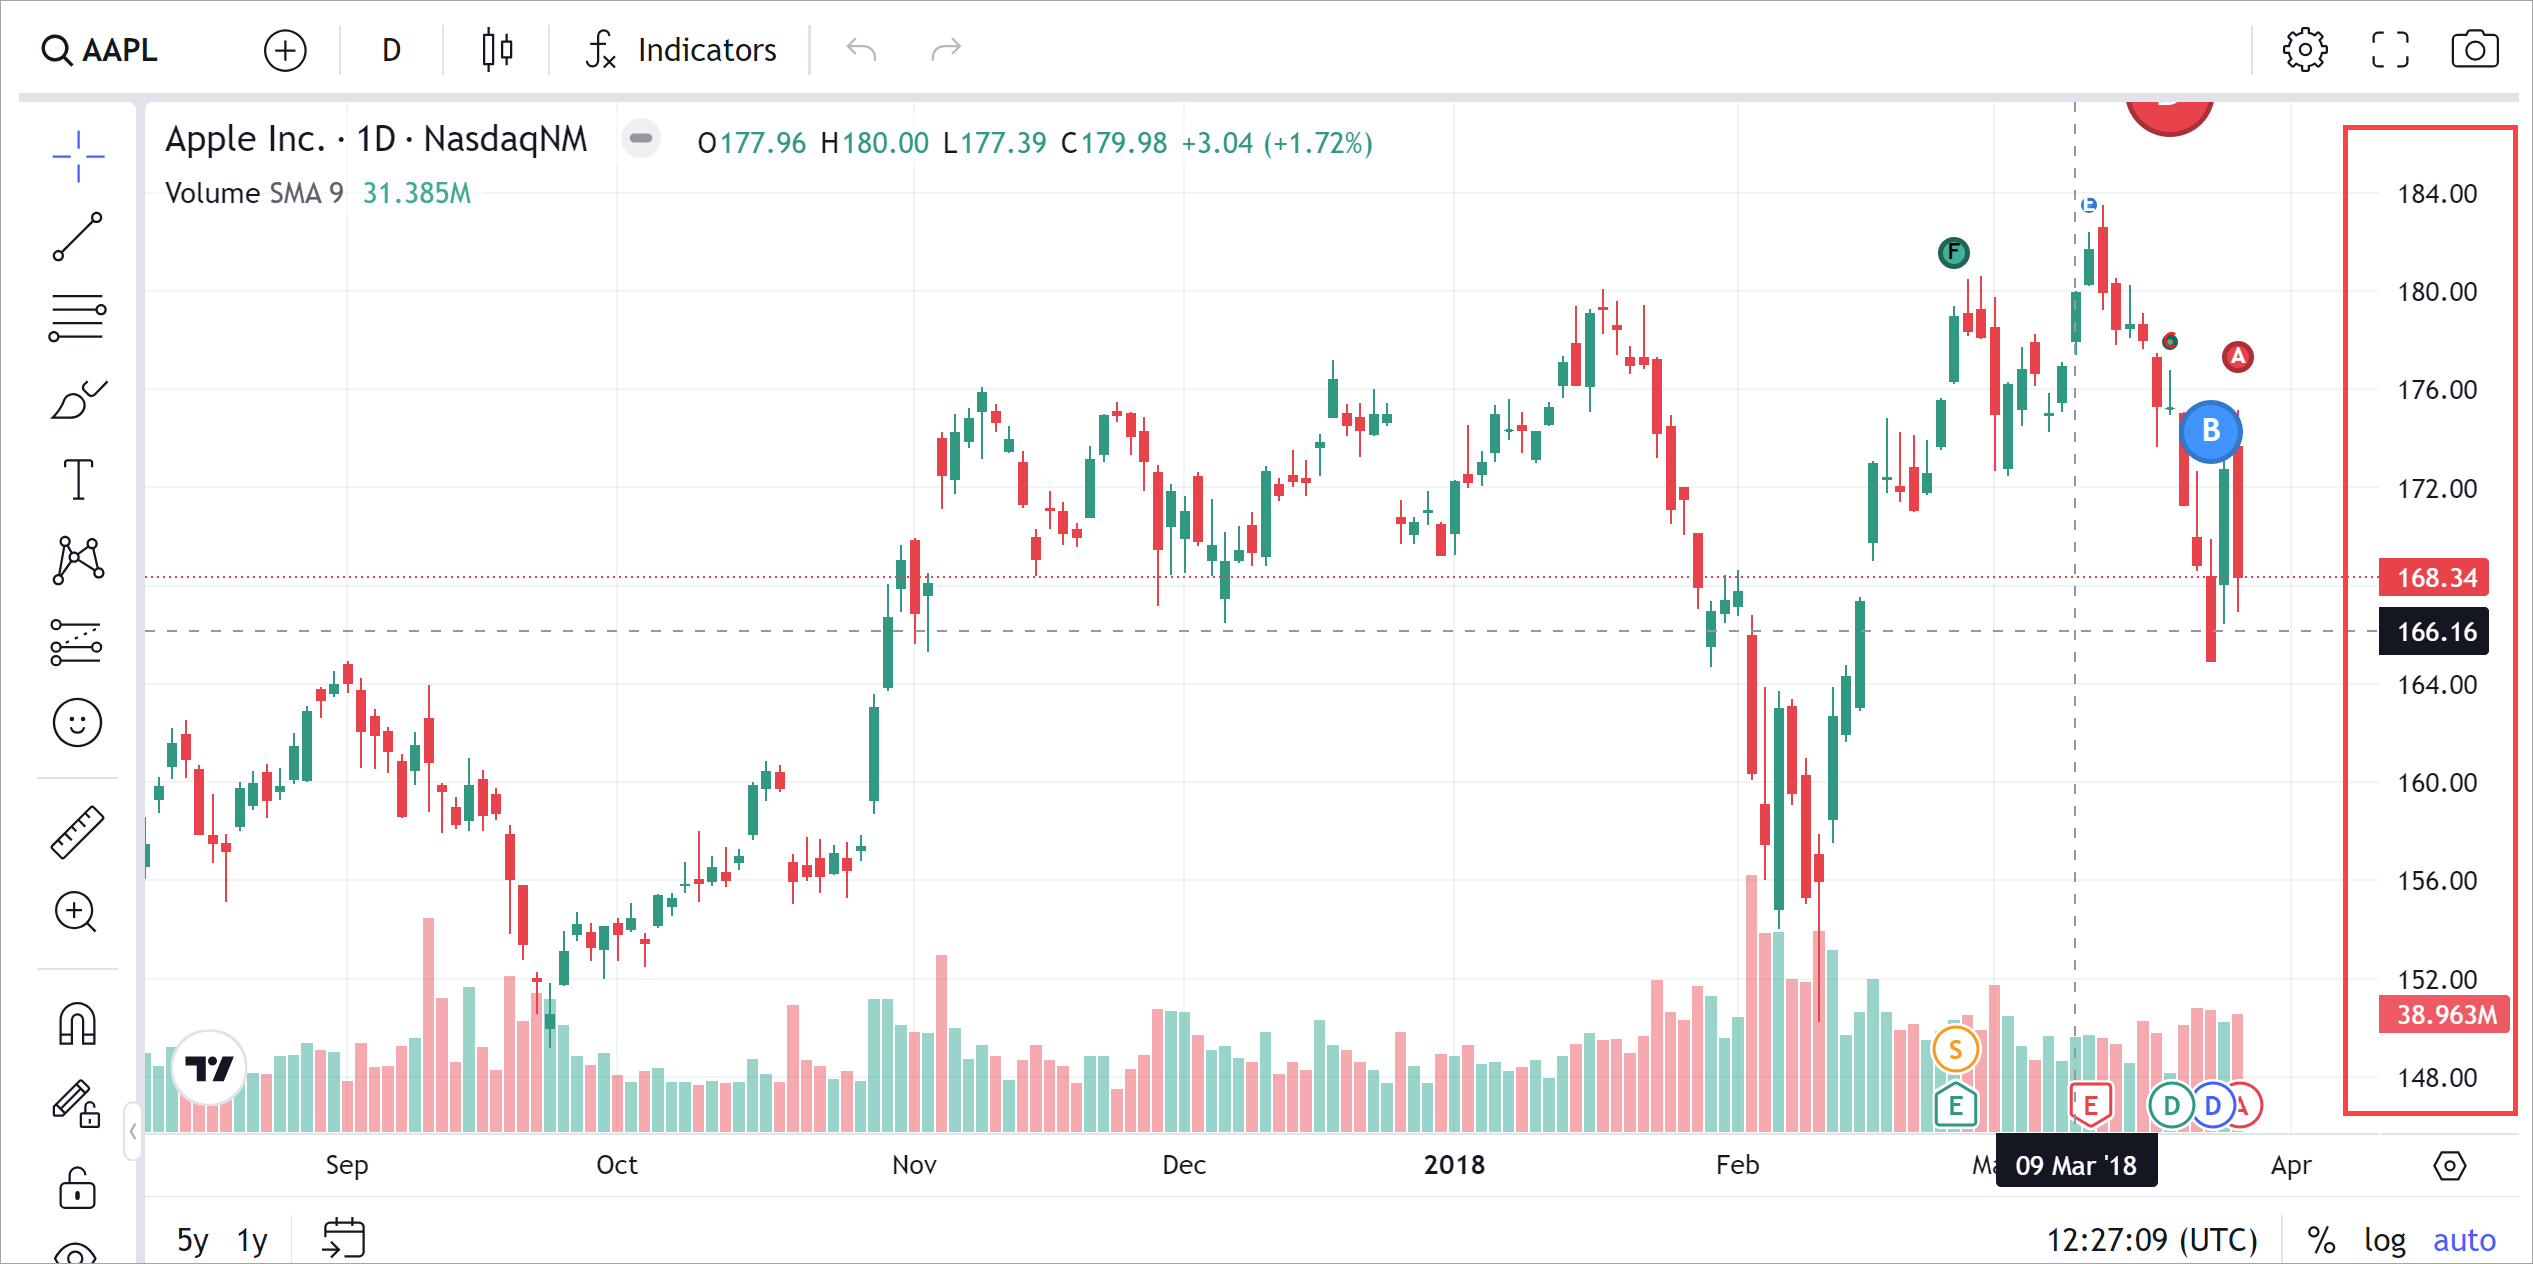
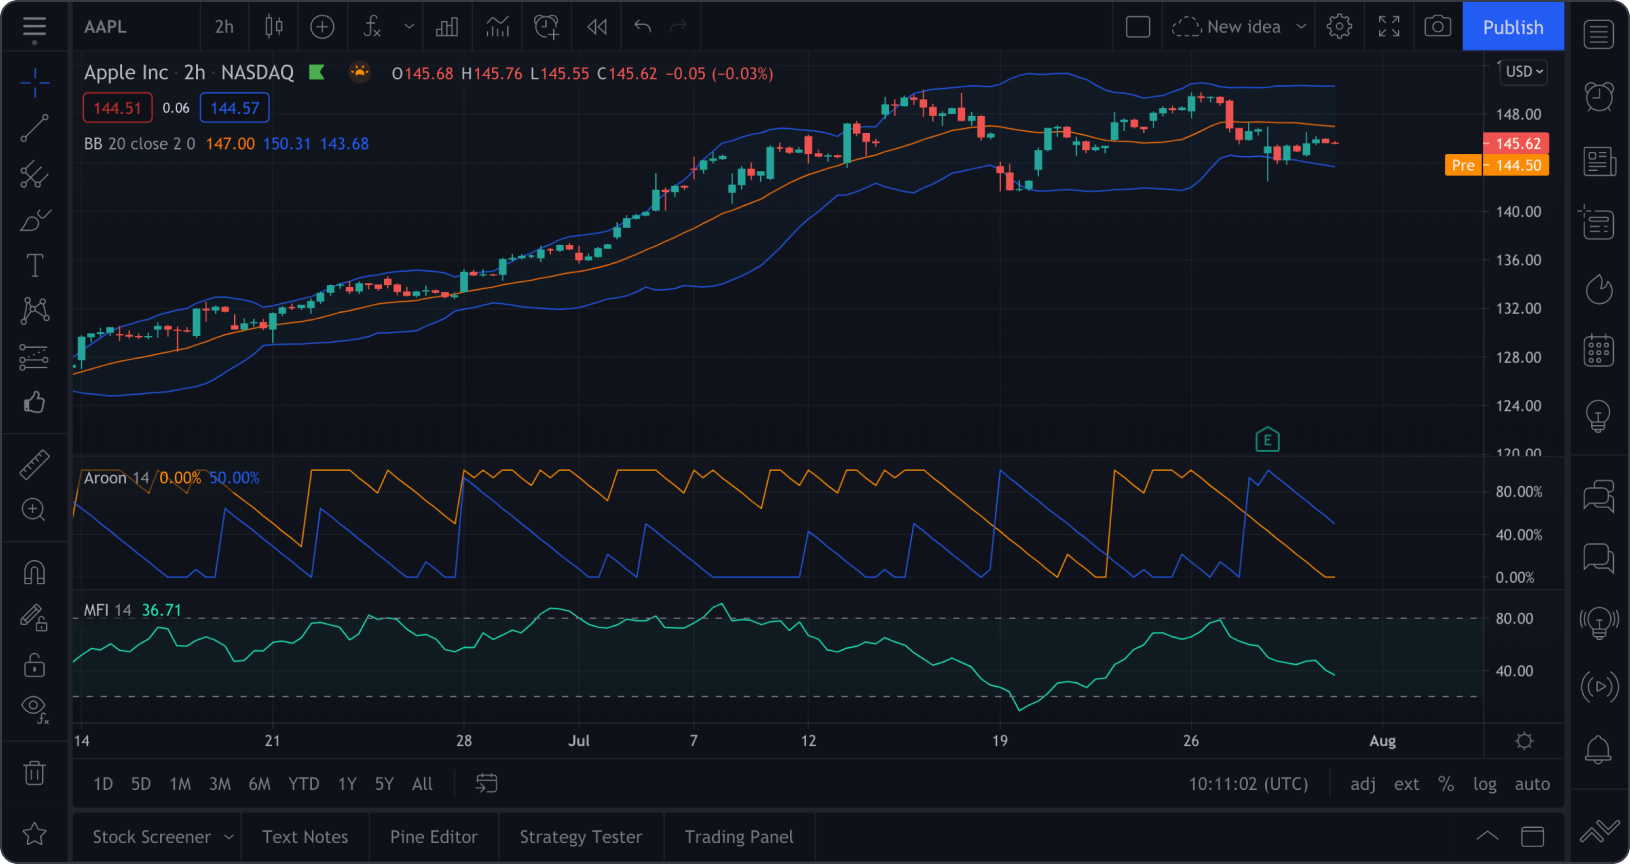
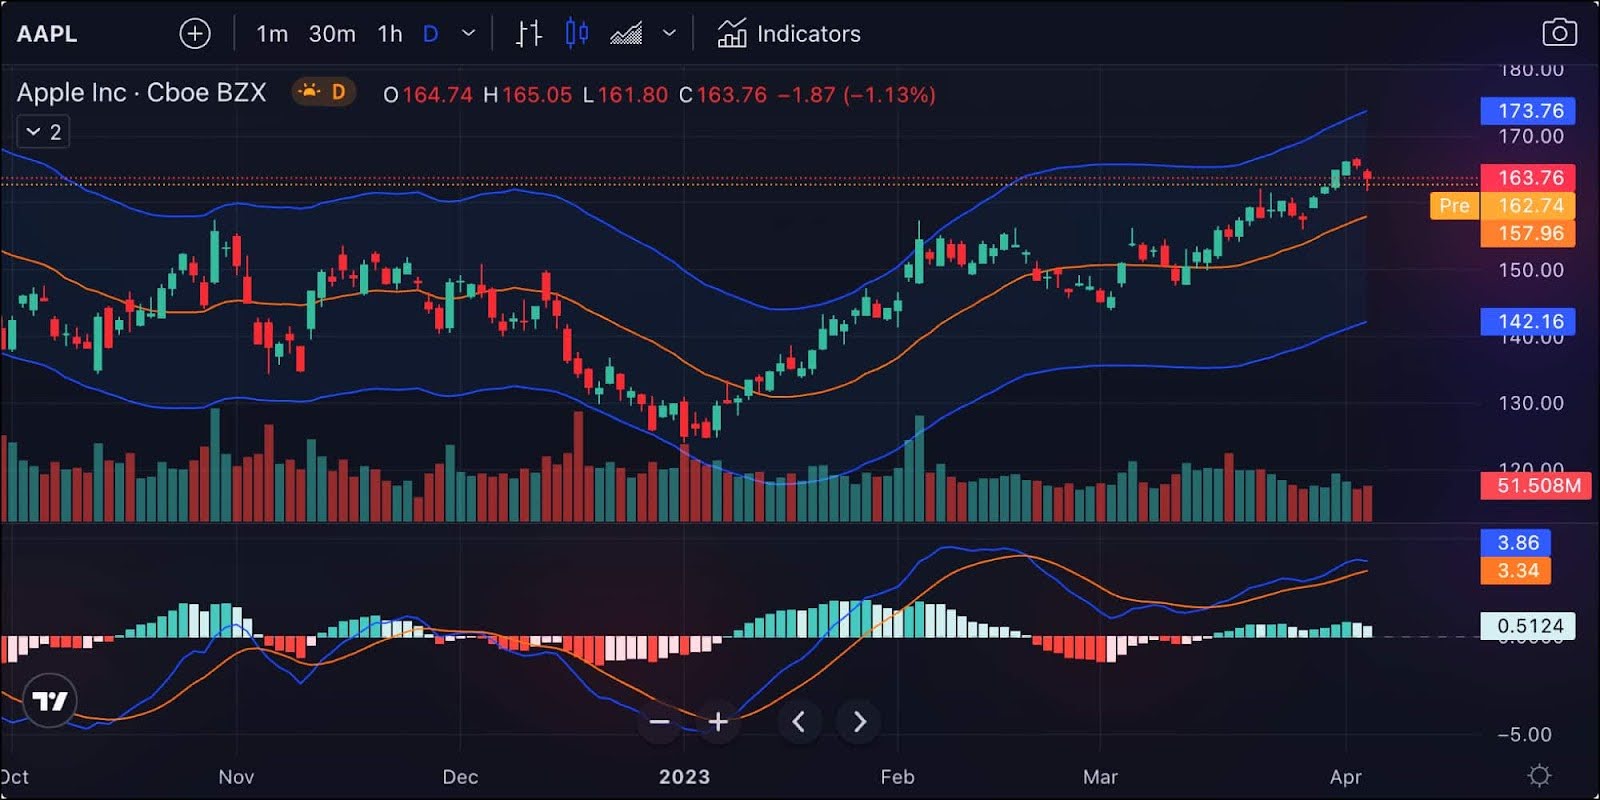
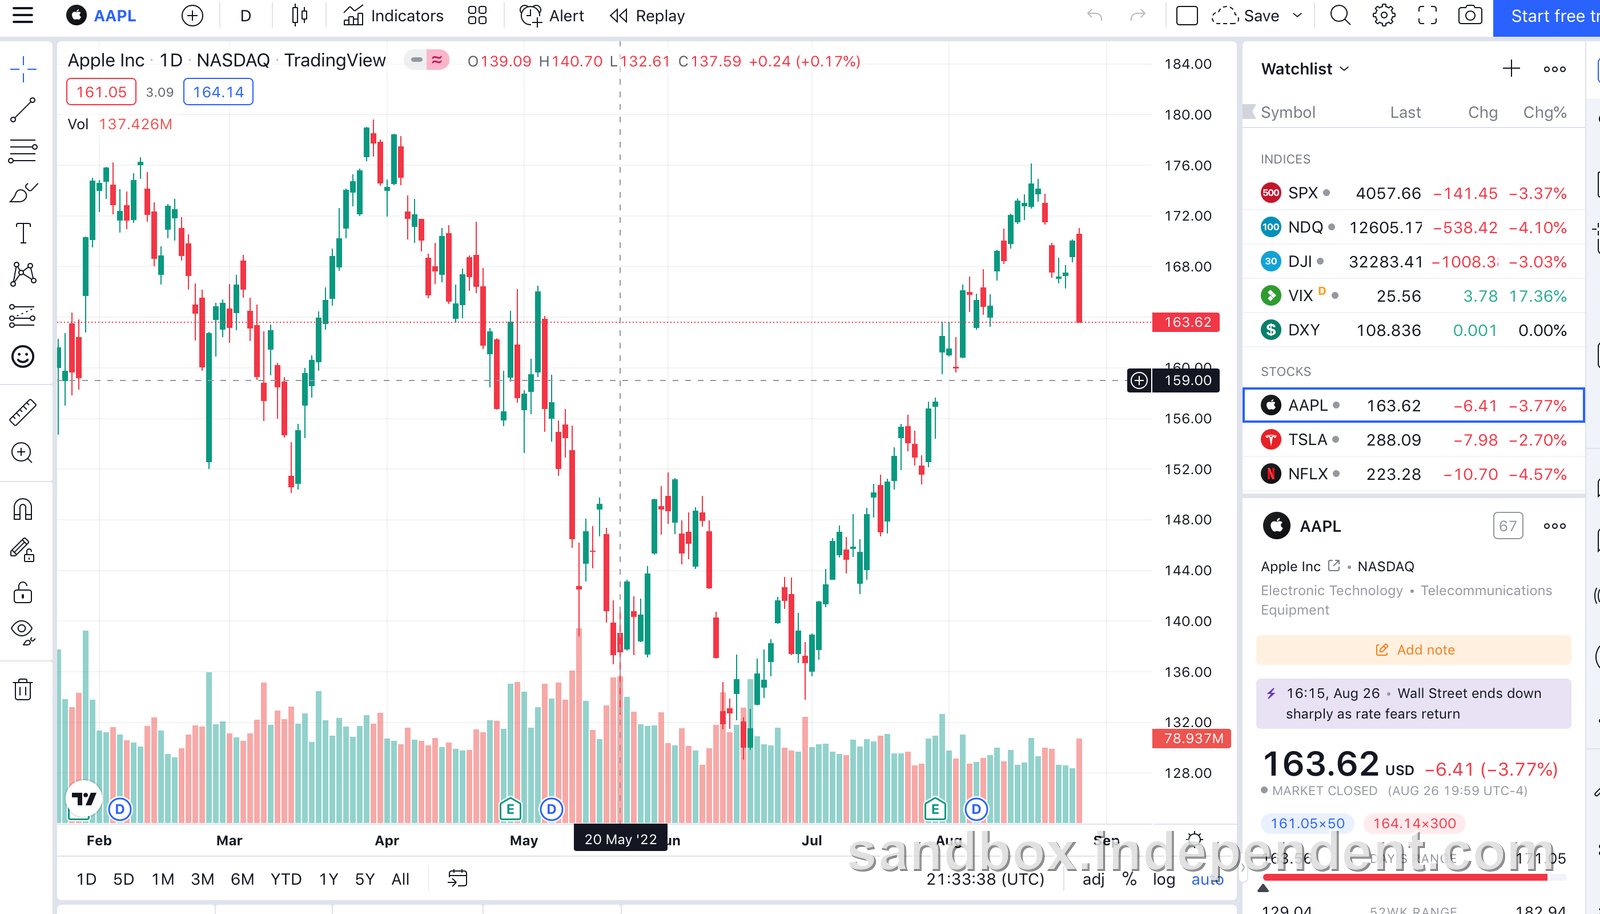
There are various chart types commonly used in the financial world. The most popular include line charts, bar charts, and candlestick charts. Each format has its strengths and is suitable for different trading strategies. Line charts offer a simple, continuous view of price changes, while bar charts provide more detail with open, high, low, and close prices. Candlestick charts are popular for their visual appeal and ability to display price patterns.
Step-by-Step Guide: Reading and Interpreting Price Charts
To read a price chart, follow these steps:
- Identify the time frame: Charts can display data for different periods, such as daily, weekly, or hourly. Choose the time frame relevant to your analysis.
- Understand the price scale: The vertical axis represents the price range. Ensure you're aware of the scale and any potential adjustments due to stock splits or dividends.
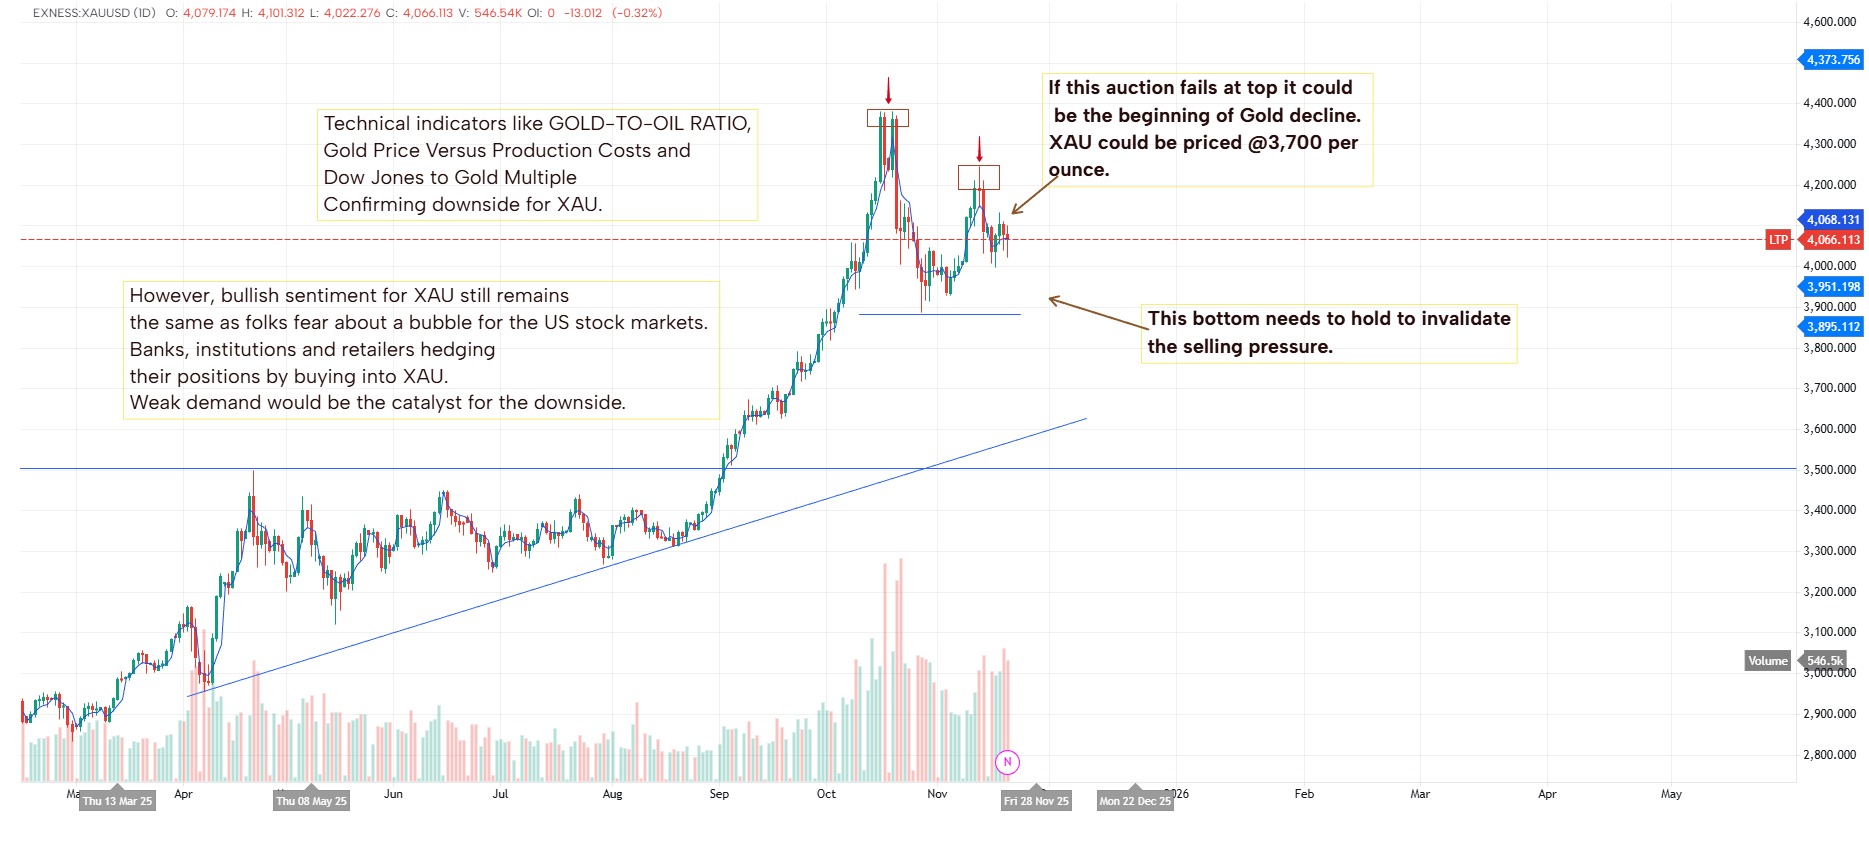
- Recognize key metrics: Look for important price levels, such as support and resistance, which indicate potential buying or selling opportunities.
- Analyze trends: Observe the overall direction of the price movement. Is it trending upwards, downwards, or ranging sideways?
- Identify patterns: Price charts often display recognizable patterns like triangles, head and shoulders, or double tops. These patterns can signal potential reversals or continuations.
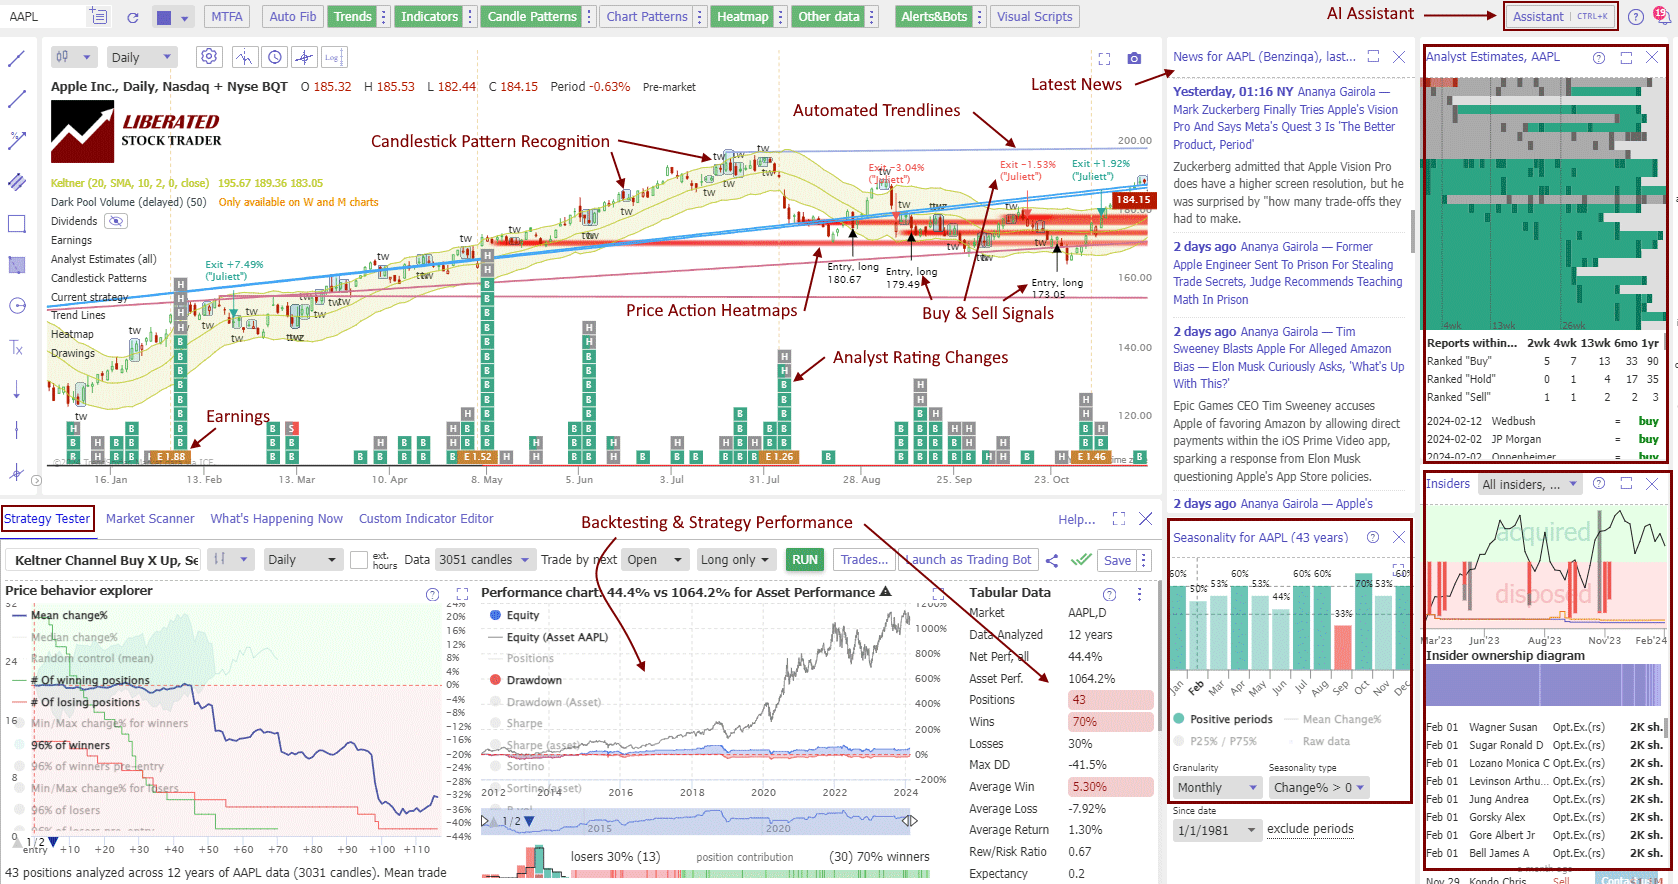
- Use technical indicators: Many charts offer additional tools like moving averages, RSI, or MACD. These indicators can provide insights into momentum, overbought/oversold conditions, and potential entry or exit points.
Common Misreadings and Pitfalls: Avoiding Mistakes
When interpreting price charts, it's essential to avoid common pitfalls:
- Don't rely solely on charts: While charts are powerful, they should be used in conjunction with other analysis methods and fundamental research.
- Be cautious of confirmation bias: It's easy to interpret charts to confirm your existing beliefs. Stay objective and consider all possibilities.
- Understand chart customization: Different platforms offer various customization options. Ensure you're familiar with the settings to avoid misinterpretations.
- Watch out for false signals: Not all patterns or indicators lead to the expected outcome. Always consider the bigger picture and use multiple signals for confirmation.
Key Factors Affecting Chart Accuracy and Real-World Use
Several factors can impact the accuracy and applicability of price charts:
Market volatility: Highly volatile markets can make it challenging to identify clear trends or patterns.
Time frame selection: Choosing the wrong time frame may lead to misinterpretations. Ensure it aligns with your trading strategy.
Data quality: Ensure you're using reliable and up-to-date data sources. Inaccurate data can skew your analysis.
Chart customization: Adjusting chart settings, like adding indicators or changing the price scale, can impact your interpretation.
Market conditions: External factors like economic news, political events, or seasonal trends can influence price movements, affecting chart patterns.
Choosing the Right Chart Format for Your Needs
The choice of chart format depends on your trading style and preferences:
- If you prefer simplicity and ease of interpretation, a line chart might be ideal.
- For detailed analysis and identifying specific price levels, bar charts offer more information.
- Candlestick charts are excellent for visualizing price patterns and understanding market sentiment.
- Consider your trading strategy and the specific insights you seek. Choose a format that aligns with your goals and provides the necessary data.
Remember, price charting apps are powerful tools, but they are just one piece of the puzzle. Combine them with other analysis methods and stay updated on market news to make well-informed trading decisions.
Well, there you have it! We've covered a lot of ground, from understanding the basics to diving into the practical aspects of using a price charting app.
Remember, while this guide provides a solid foundation, every situation is unique. So, before you finalize your charts and references, take a moment to ensure they align perfectly with your specific needs and context. It's a simple step but an important one!
Feel free to explore more of our guides; we've got a range of topics that might just spark your interest and offer practical insights. Happy charting!
Images